Important: Your workbook must be saved to track run history. Unsaved workbooks will show the current run log, but previous runs may not be recorded until saved.
How to Access the Run Log
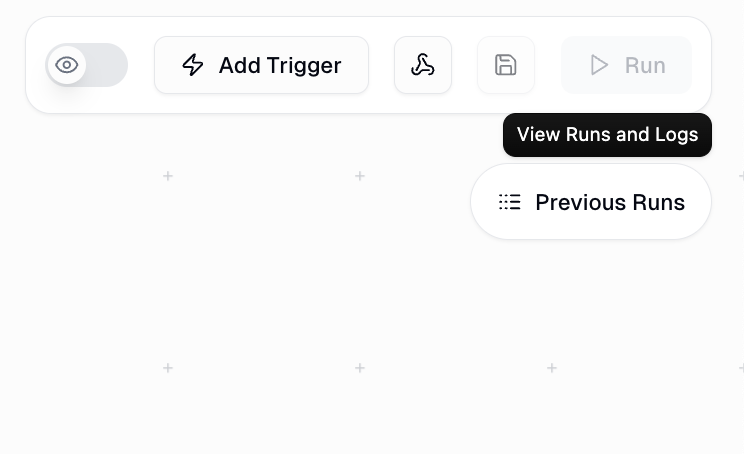
There are two ways to access the Run Log depending on where you are in Gumloop:- From a Run Link
- From Previous Runs
When You’re on a Run Link
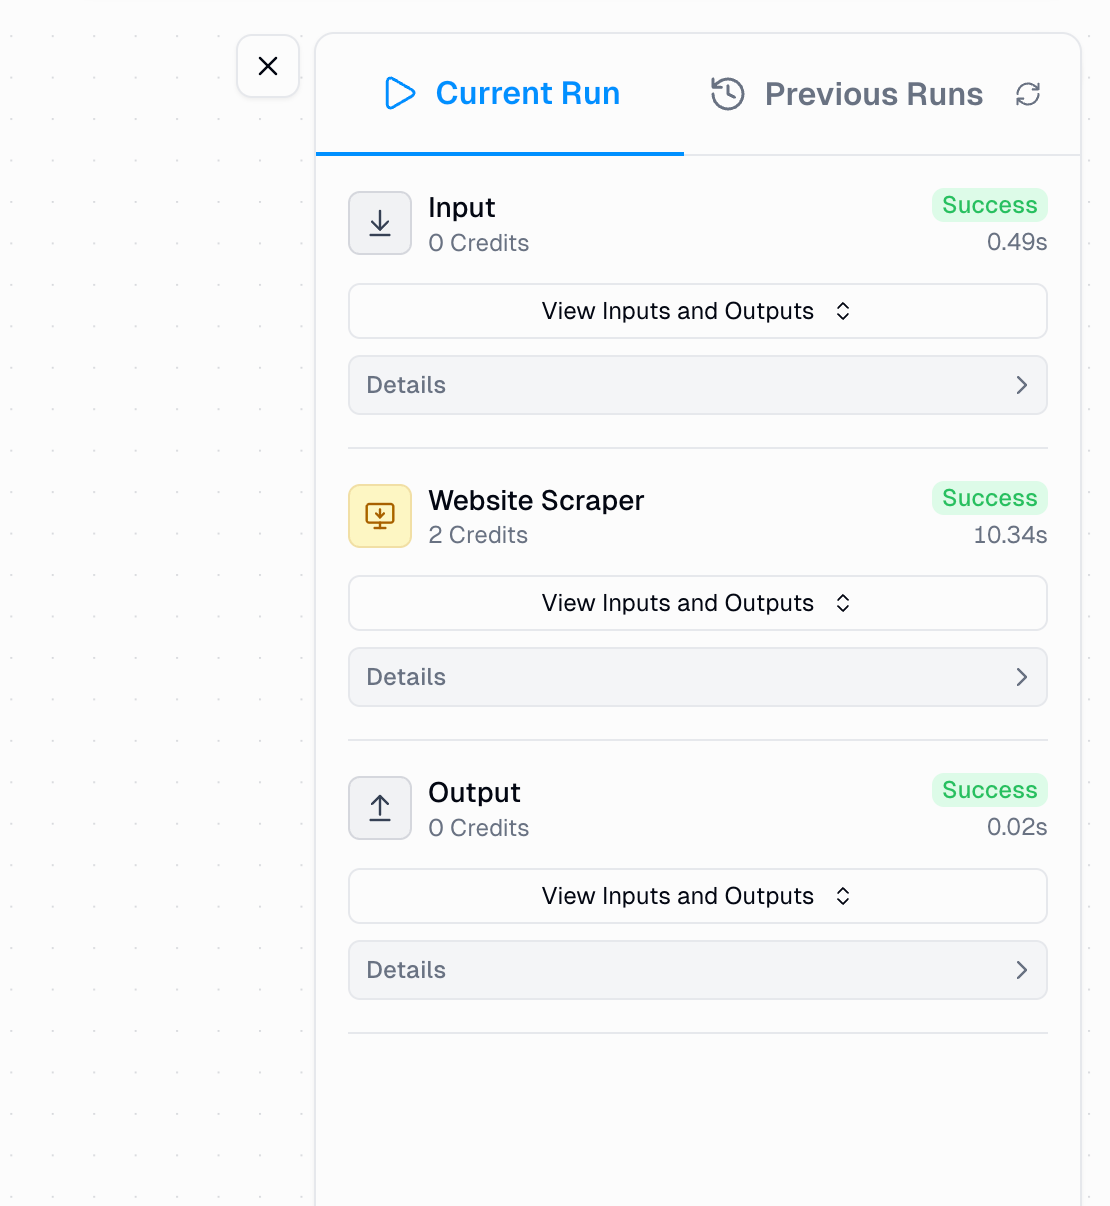
You can identify if you’re on a run link by checking your URL - it will contain arun_id parameter.Example URL:- The Current Run panel appears on the right-hand side
- It automatically displays the execution details for that specific run
- You’ll see all node statuses, execution times, and outputs
What You’ll See in the Run Log
Once you’ve accessed the Run Log, here’s what information is available:Execution Status
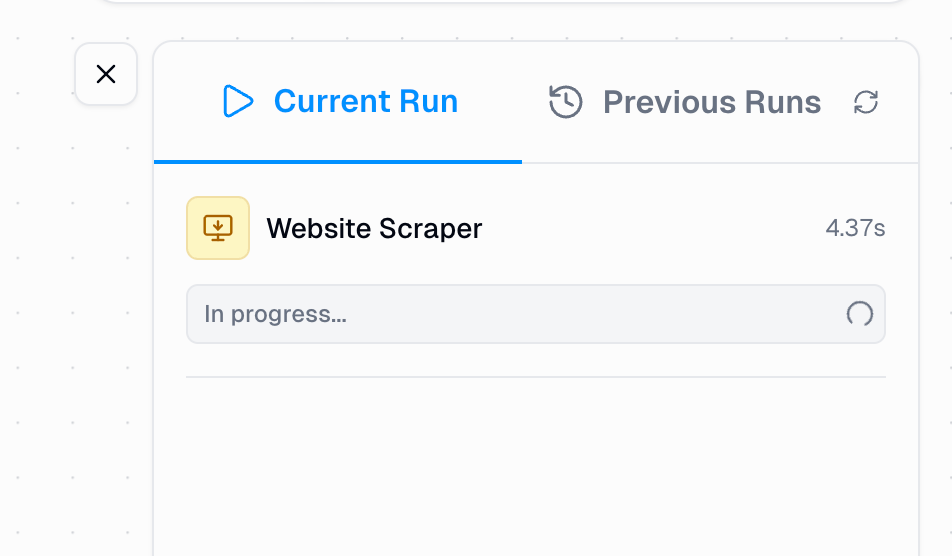
Real-time status indicators for each node showing success, errors, or running state
Performance Metrics
Time taken by each node and total workflow execution time
Credit Tracking
Credit costs per node and total credits consumed by the workflow
Data Inspection
Complete access to inputs and outputs for every node
Run Log Components
Execution Status Indicators
Each node displays a clear status indicator to help you quickly identify execution results:- Success
- Error
- Running
Green checkmark - Node executed successfully without errorsThis means the node completed its task and passed data to the next node as expected.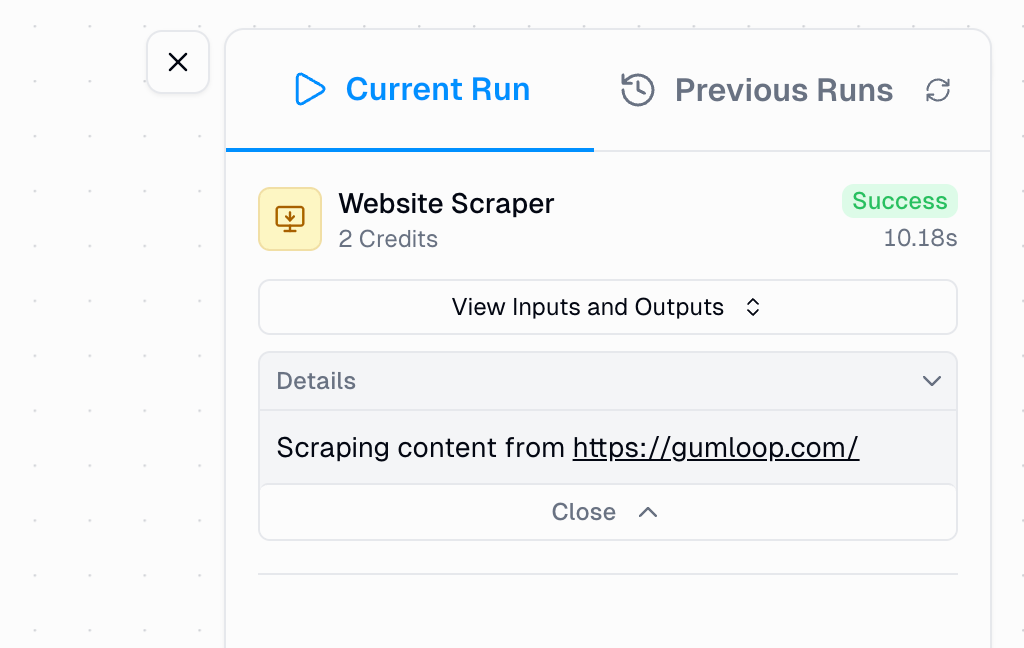
Time and Credit Information
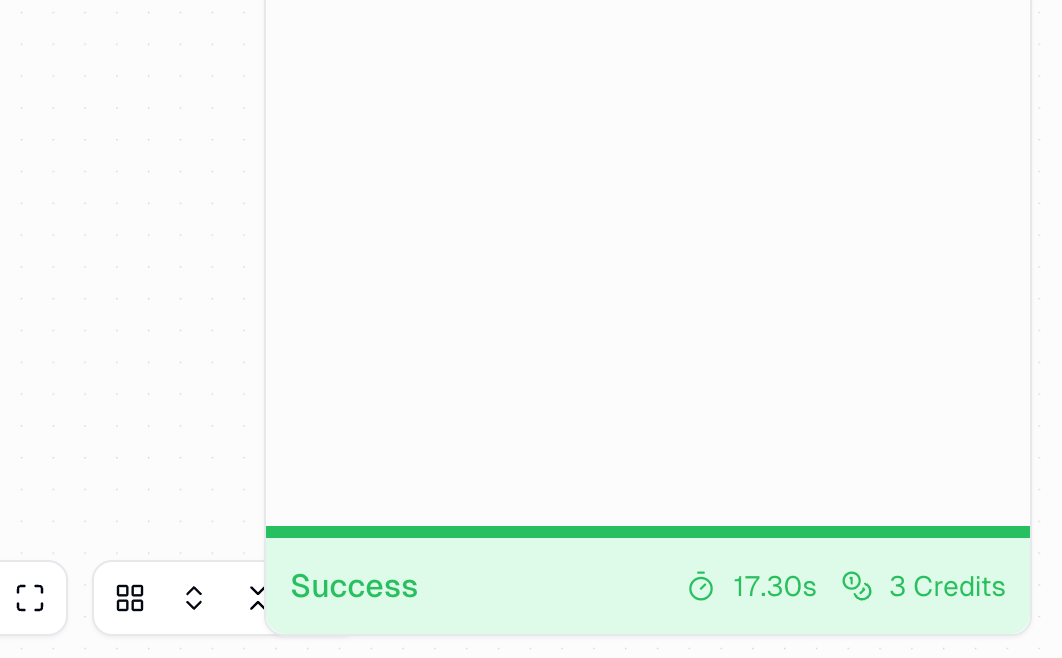
Monitor the performance and cost of your workflow execution: Per Node:- Execution time: Duration each node took to run (e.g., “6.18s”)
- Credit cost: Number of credits consumed by that specific node
- Total execution time: Cumulative time for the entire workflow
- Total credits consumed: Sum of all node credit costs
Inspecting Inputs and Outputs
One of the most powerful debugging features in the Run Log is the ability to inspect exactly what data flows between nodes.How to View Data
1
Open the modal
Click the “See all inputs and outputs” button for any node in the Run Log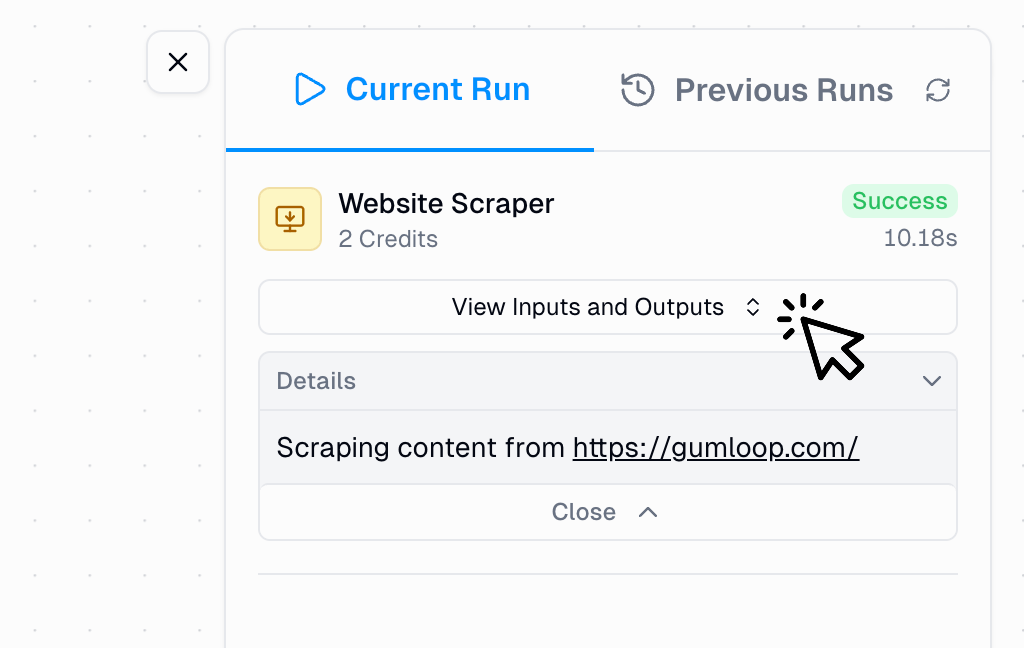
2
Review the data
A modal appears displaying: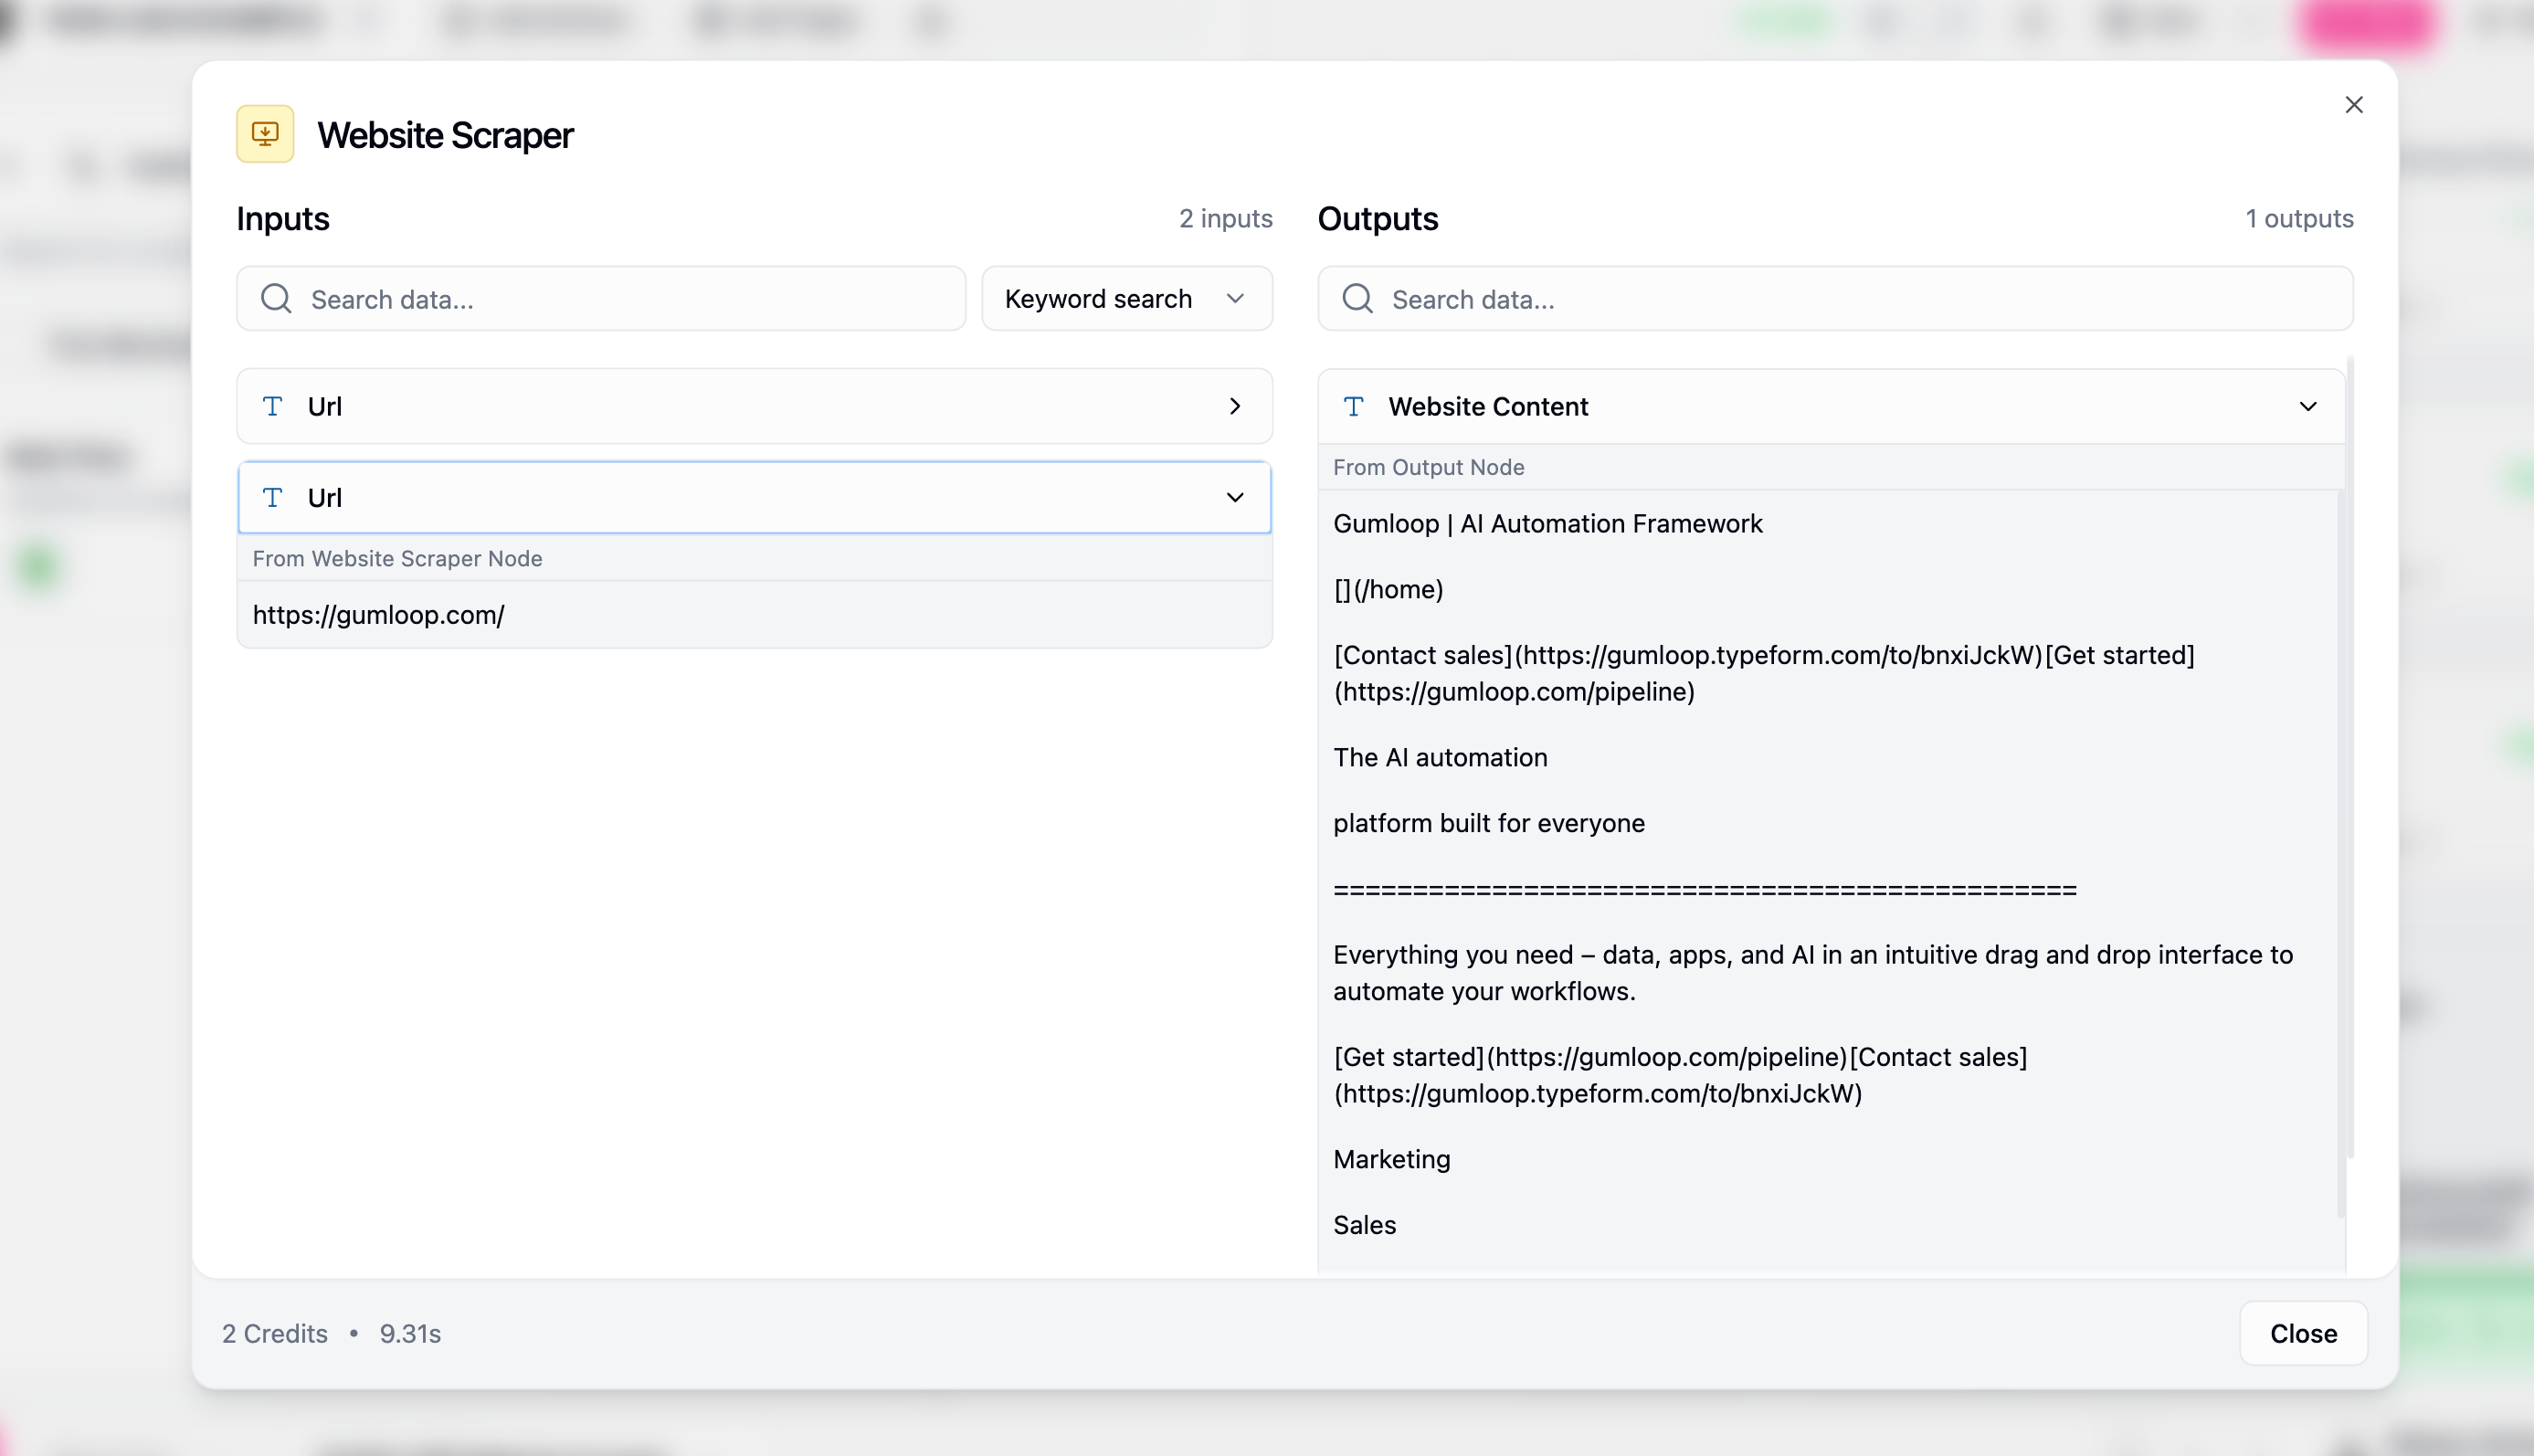
- All input data the node received from previous nodes
- All output data the node produced for downstream nodes
Understanding Data Display
The modal shows data according to its type, with visual icons to help you quickly identify what you’re looking at:When to Use Input/Output Inspection
When to Use Input/Output Inspection
This modal is invaluable for:
- Verifying data flow between nodes is working correctly
- Checking text formatting matches your expectations
- Ensuring list items contain the expected values
- Confirming files are being processed properly
- Debugging errors by seeing exactly what data caused issues
Pro Debugging Tips
Pro Debugging Tips
- Start debugging from the first failed node and work backwards
- Compare inputs vs outputs to see how each node transforms data
- Use inputs/outputs to understand why a node produced unexpected results
- Check for empty inputs that might indicate issues with previous nodes
- Look for the type icons to quickly understand data structure
Working with Subflows
Subflows have special Run Log behavior that helps you debug complex, nested workflows.Navigation Between Parent and Subflow
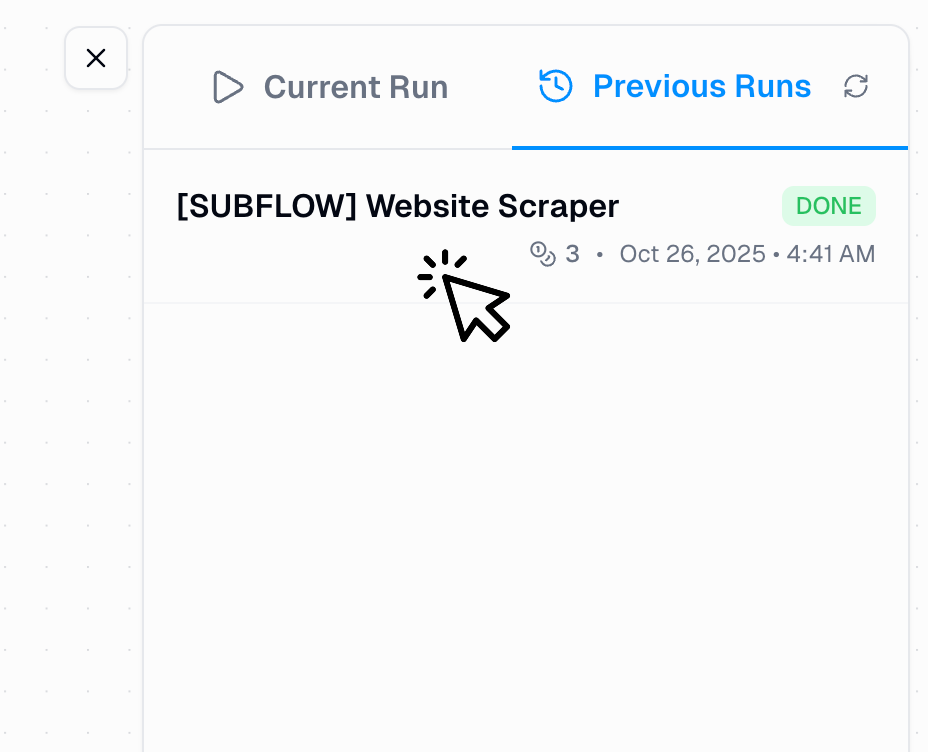
When your workflow contains subflows, the Run Log provides two levels of visibility:- Parent Workflow View: Shows the subflow as a single node with overall status
- Subflow Detail View: Shows individual node execution within the subflow
1
Click the subflow node
In the parent workflow’s Run Log, click on any subflow node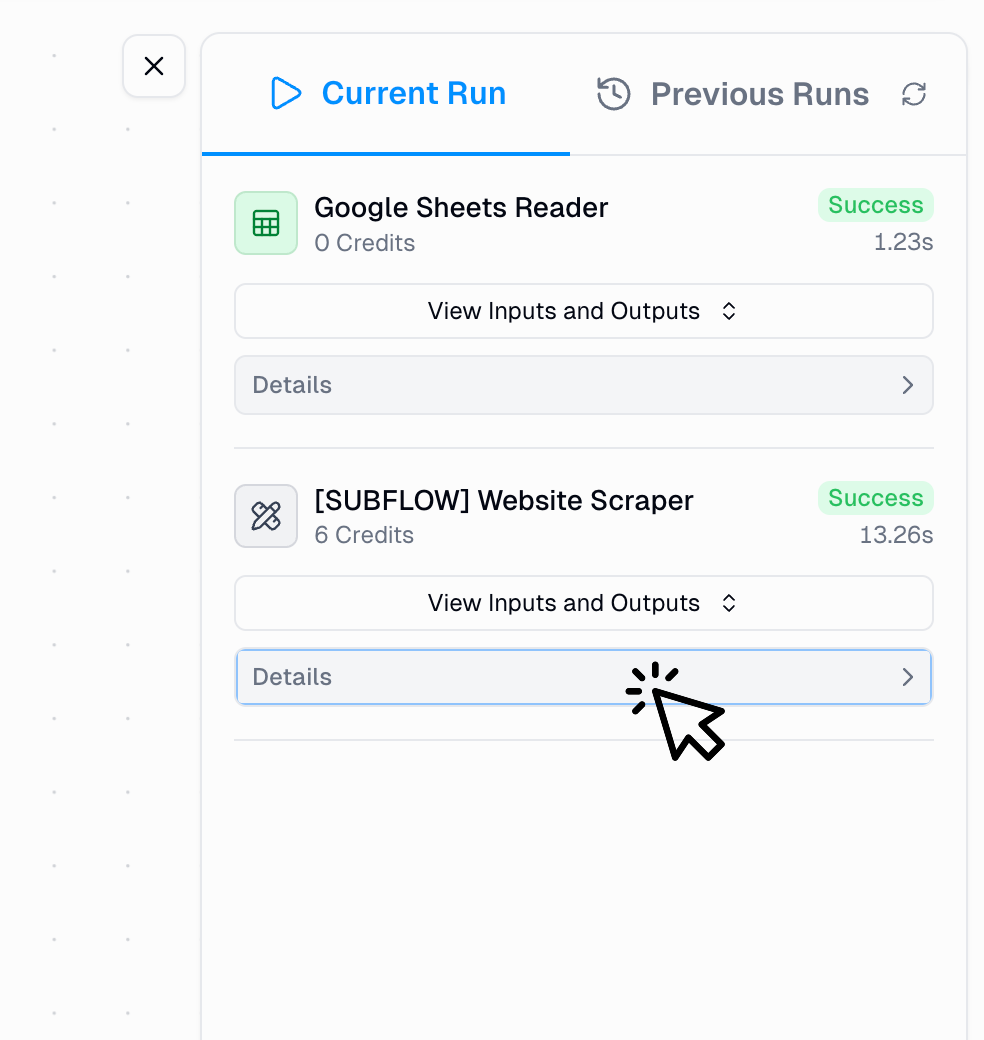
2
Click 'View Run'
A “View Run” option appears - click it to see detailed subflow execution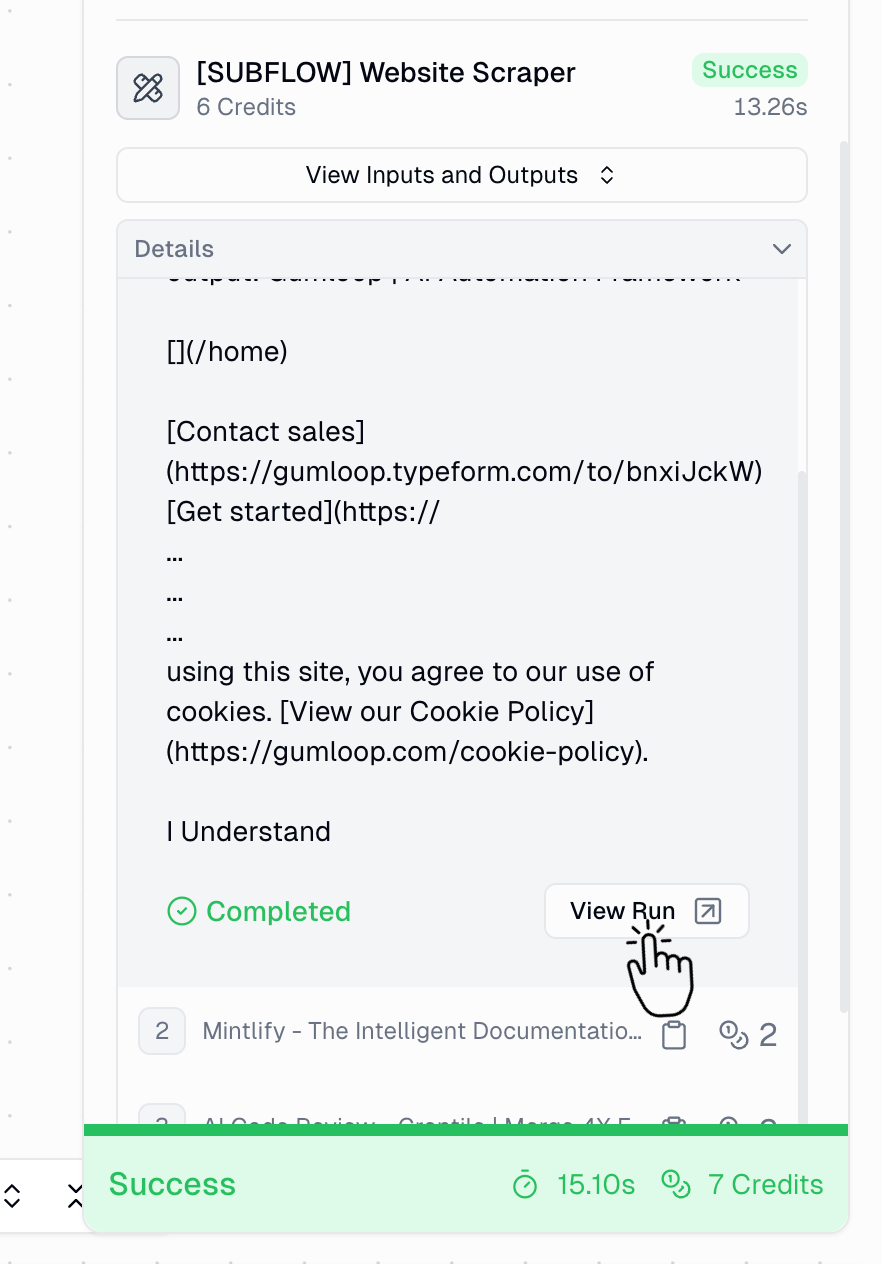
3
Return to parent
Use the workflow tabs at the bottom of the screen to navigate back to the parent workflow
Why this matters: This navigation lets you pinpoint exactly where issues occur in complex workflows and see how data flows through different levels of your automation.
Loop Mode Execution
When nodes run in Loop Mode, the Run Log enumerates each iteration, giving you visibility into how individual items are processed.Viewing Loop Mode Details
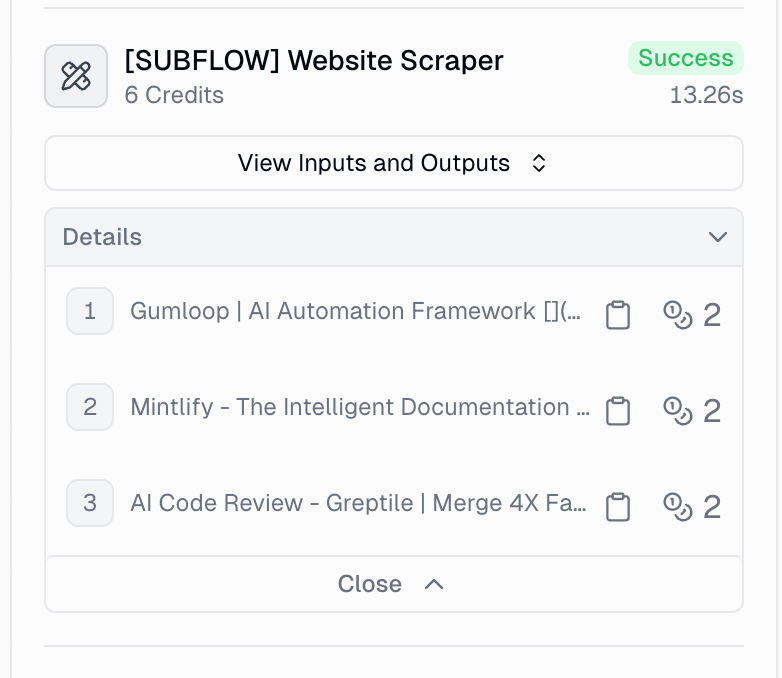
- How It Works
- Common Issues
In Loop Mode:
- Expand the node or subflow in the Run Log
- Each iteration is numbered (1, 2, 3, etc.)
- Click any iteration to view its specific inputs/outputs
- Monitor which items succeeded or failed individually
Debugging with the Run Log
Common Error Patterns
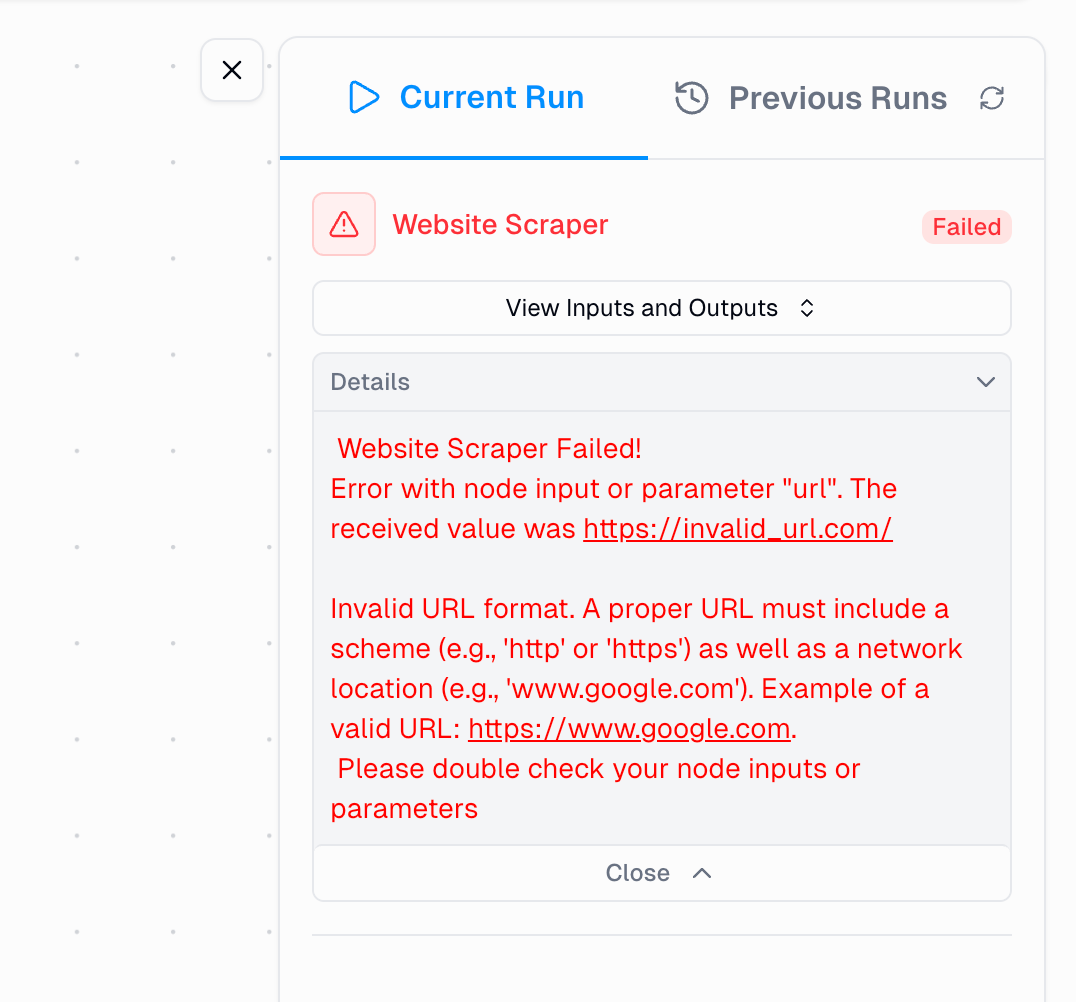
Authentication Errors
Authentication Errors
How it appears: “Failed to authenticate” or “Credentials not found”Solution:
- Check your credentials in Credentials settings
- Verify credentials haven’t expired or been revoked
- Re-authenticate the integration if necessary
Empty Input Errors
Empty Input Errors
How it appears: “No input provided” or “Input is required”Solution:
- Inspect the previous node’s output using the input/output modal
- Ensure the previous node is outputting data as expected
- Check for type mismatches between nodes
Timeout Errors
Timeout Errors
How it appears: “Request timed out” or “Execution exceeded time limit”Solution:
- Break large operations into smaller chunks using Loop Mode
- Add error handling with Error Shield nodes
- Consider using pagination for data source nodes
Systematic Debugging Approach
1
Identify failed nodes
Scan the Run Log for nodes with error status indicators
2
Inspect inputs and outputs
Use the input/output modal to see exactly what data the node received and produced
3
Review error messages
Read the specific error information in the node’s output
4
Trace data flow
Follow how data changes as it moves through your workflow to identify where issues begin
5
Check subflows
For complex workflows, drill down into subflow runs to isolate the exact location of issues
6
Compare with history
Reference previous successful runs to identify what changed
Best Practices
Test with Small Samples
Run workflows with limited data first to quickly identify and fix issues before processing large datasets
Use Error Shield
Wrap critical nodes in Error Shield nodes to see both success and failure paths
Monitor Credit Costs
Track credit usage in the Run Log to optimize efficiency and reduce unnecessary costs
Save Your Workbook
Always save your workbook to preserve run history for future troubleshooting and comparison
Document Run Links
Share run links with team members when asking for help or documenting issues
Review Regularly
Check previous runs periodically to catch patterns in errors or performance degradation
Quick Reference: Run Log Features
Need More Help?
Contact Support
Need help? Reach out to us and we’ll assist you.
Error Troubleshooting
Learn how to fix common errors like list size mismatches
Error Shield Node
Add error handling to your workflows for better debugging
Credentials Setup
Configure authentication for integrations
Summary
The Run Log is your most powerful tool for understanding, debugging, and optimizing Gumloop workflows. By mastering its features - from status indicators to input/output inspection to subflow navigation - you can: ✅ Quickly identify and resolve issues with detailed error information✅ Understand data flow through your entire automation
✅ Optimize performance by monitoring execution time and credit usage
✅ Collaborate effectively by sharing run links with your team
✅ Track improvements by comparing runs over time