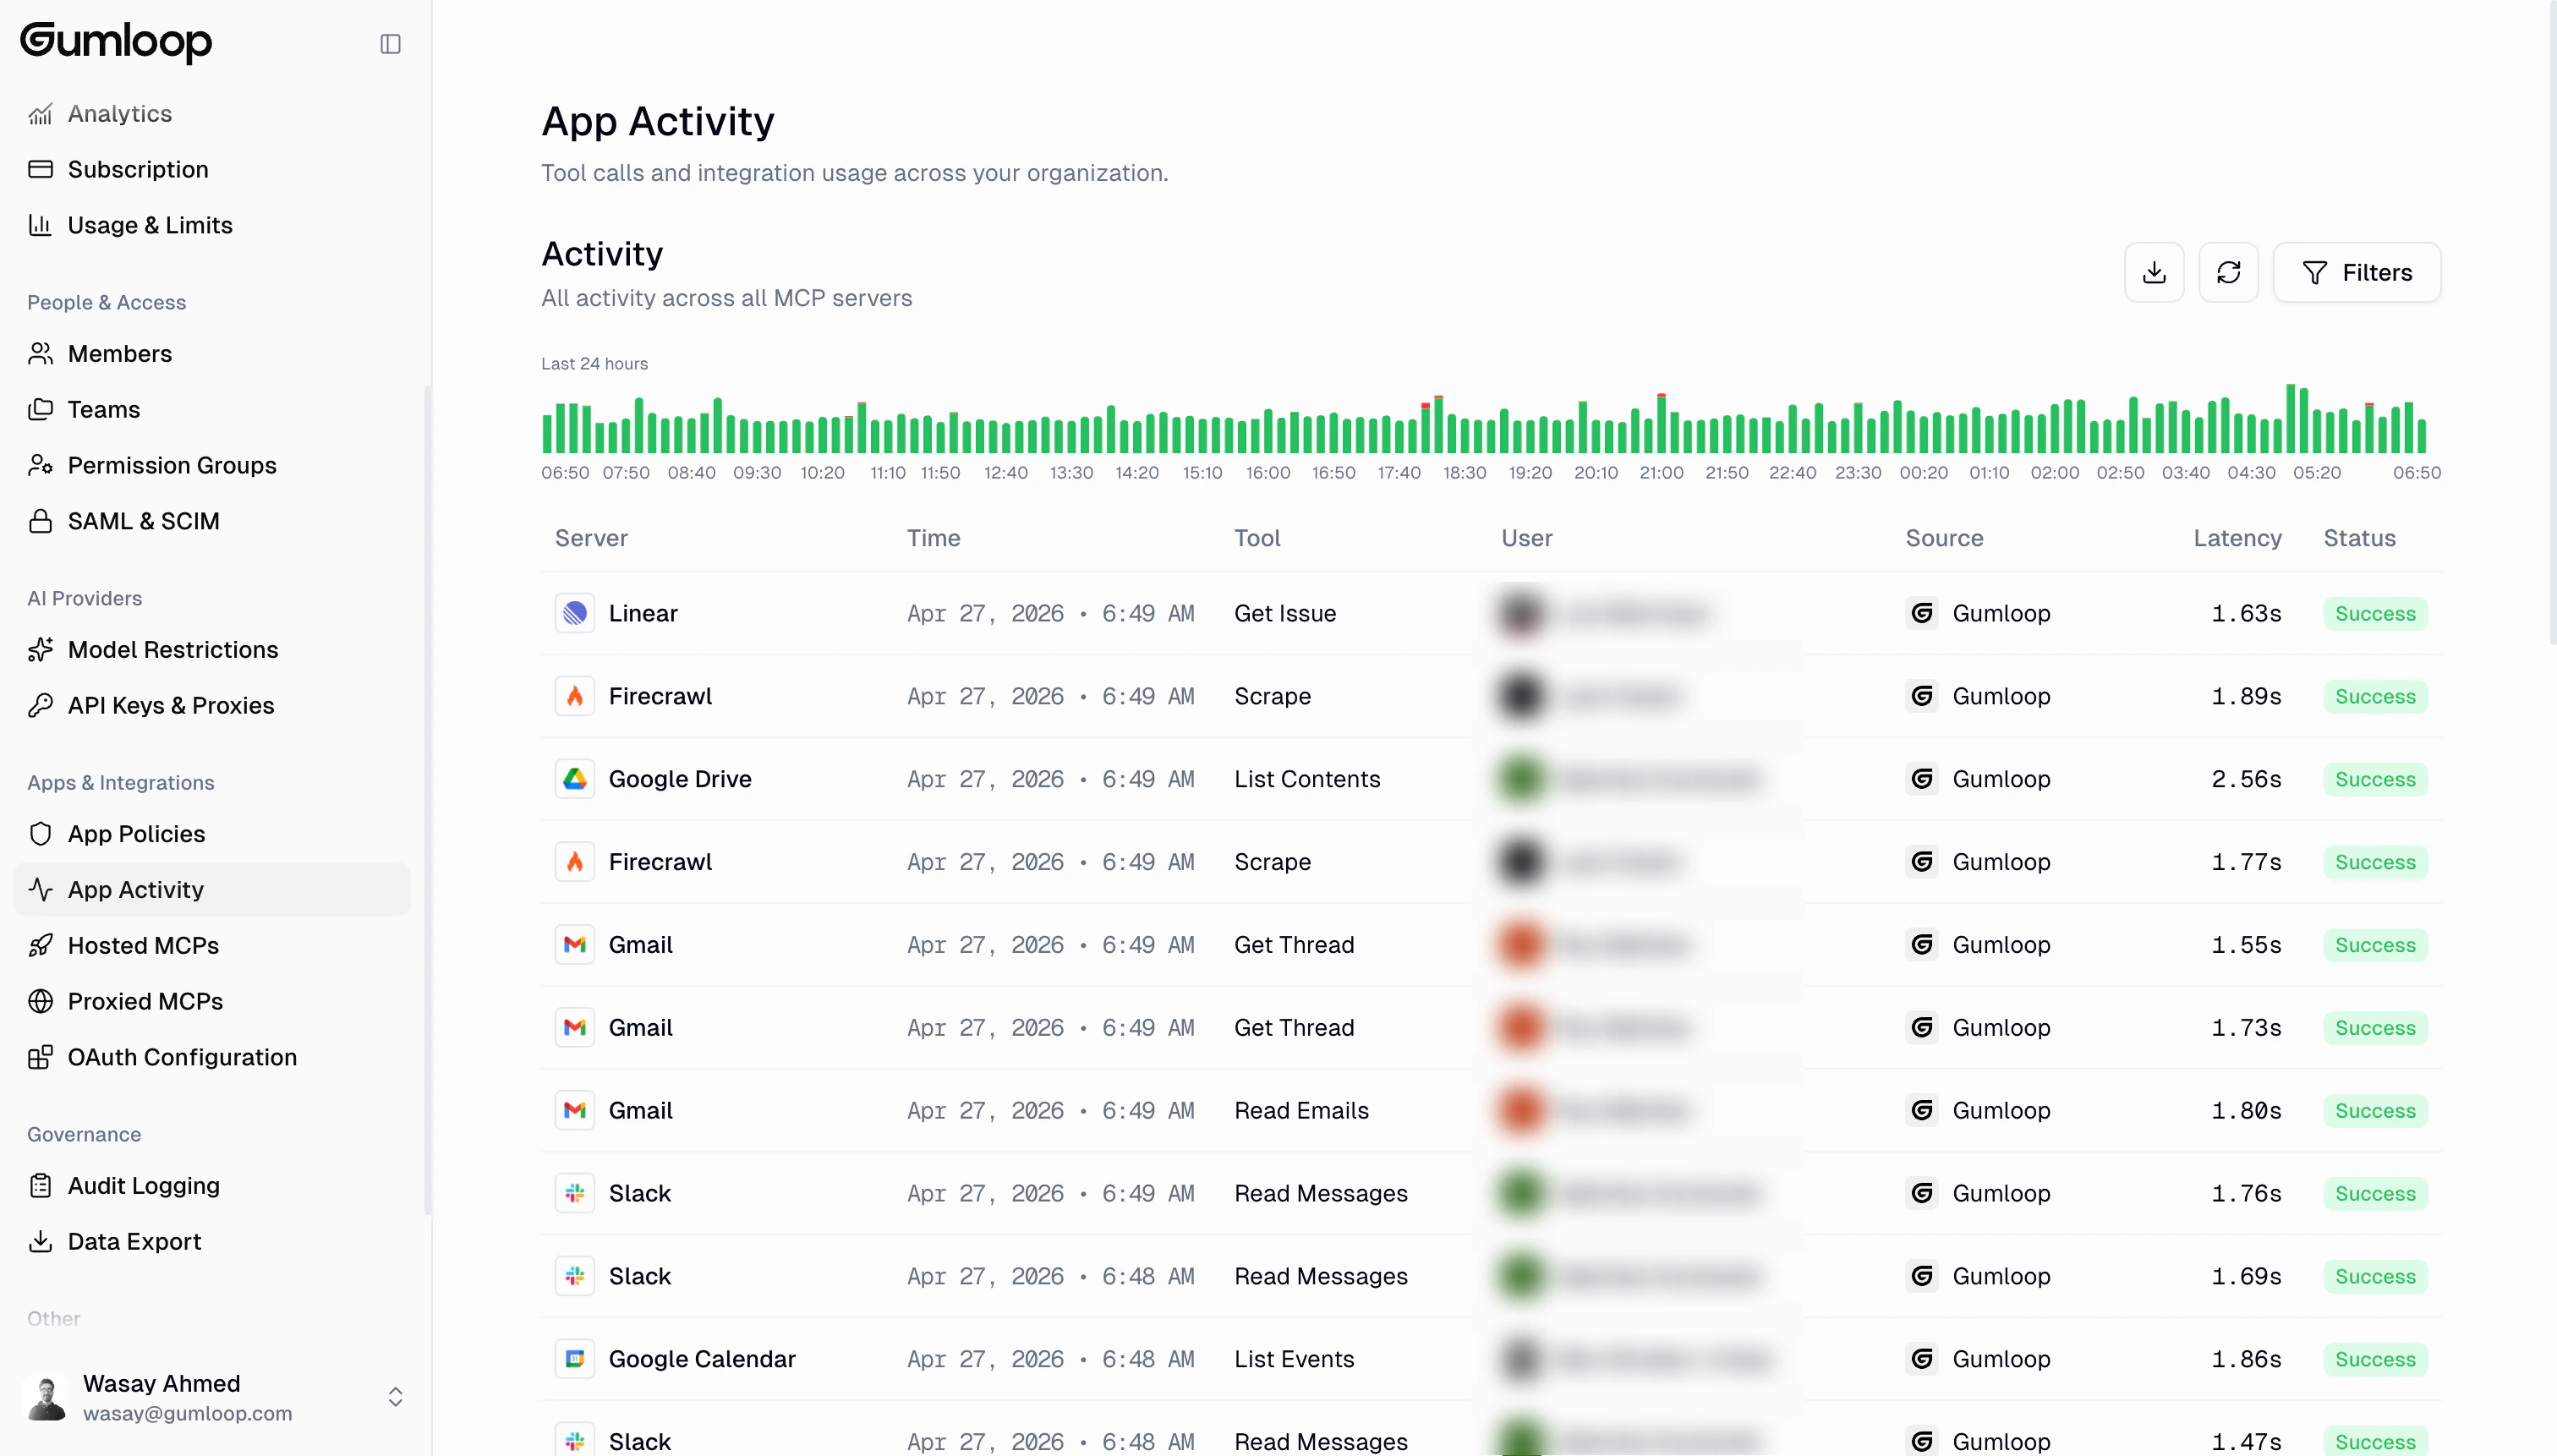
Where to find it
Go to Settings → Organization → App Activity at gumloop.com/settings/organization/activity.Activity Histogram
At the top of the page, a histogram shows tool call volume over the last 24 hours. Each bar represents a time interval, color-coded by status:- Green: Successful calls
- Red: Errors or blocked calls
The histogram is visible when viewing the Last 24 hours date range.
Selecting a custom date range longer than 24 hours hides the histogram and
shows only the table.
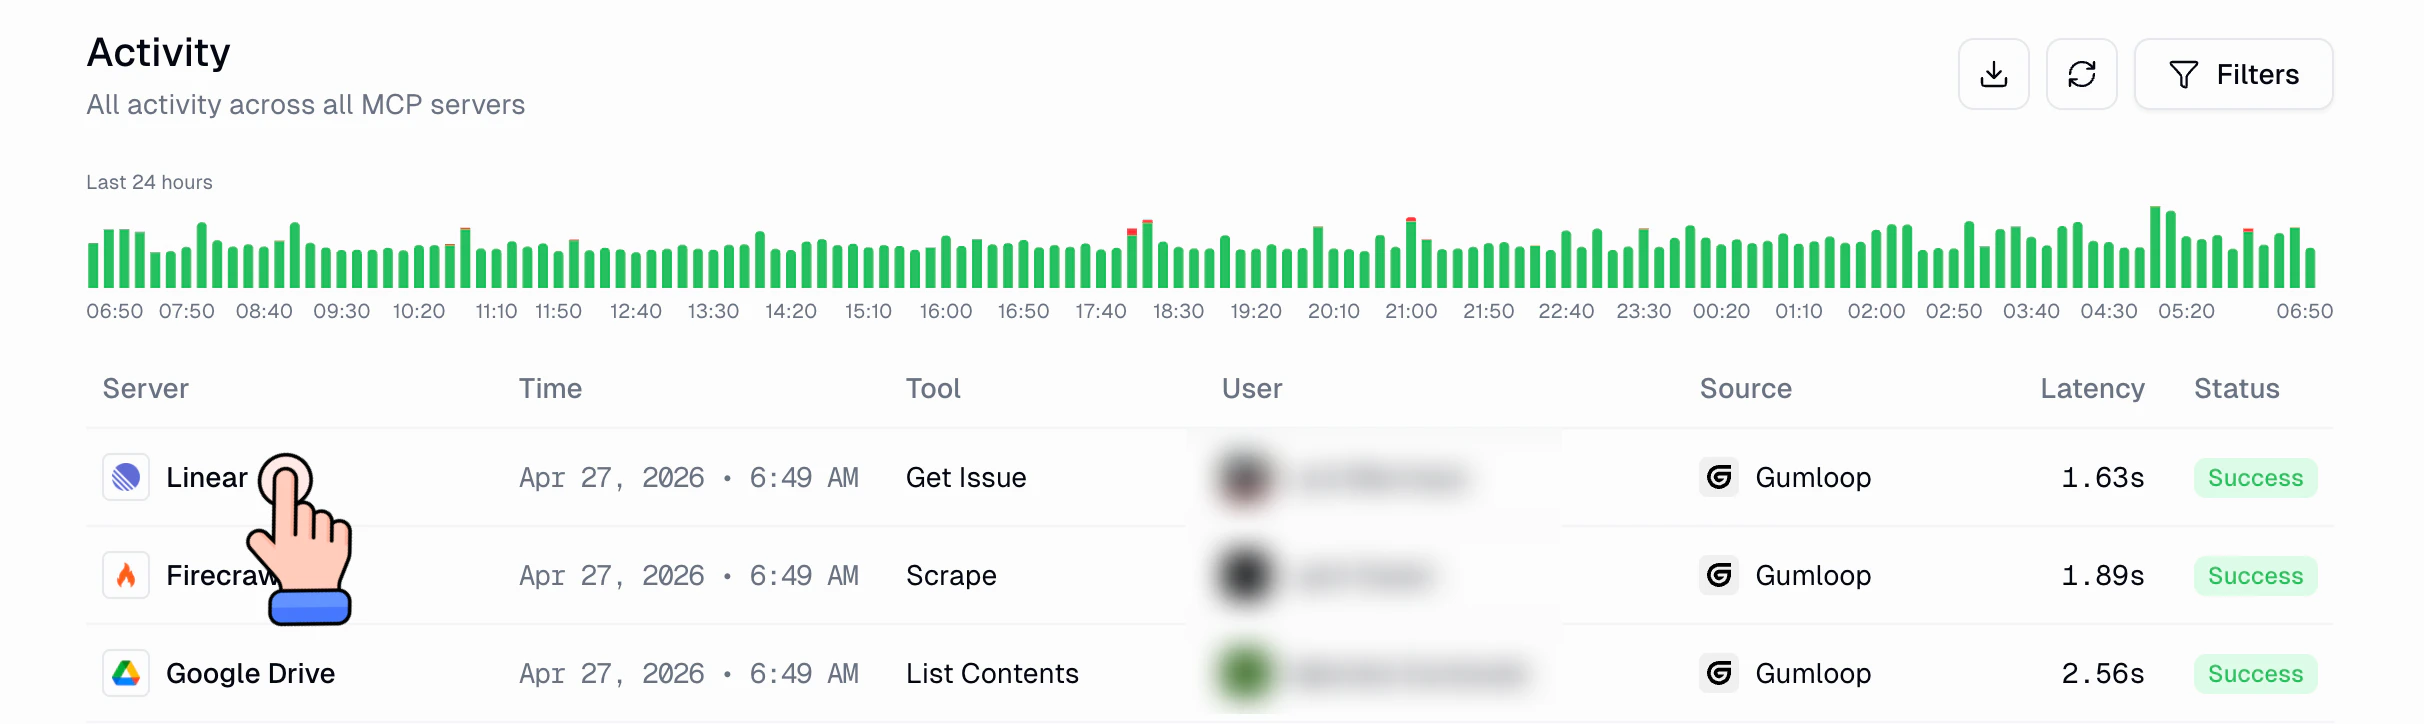
Activity Table
Below the histogram, a table lists every tool call with these columns:
Clicking any server name in the table takes you directly to that server’s detail page, where you can see server-specific activity, tools, and settings.
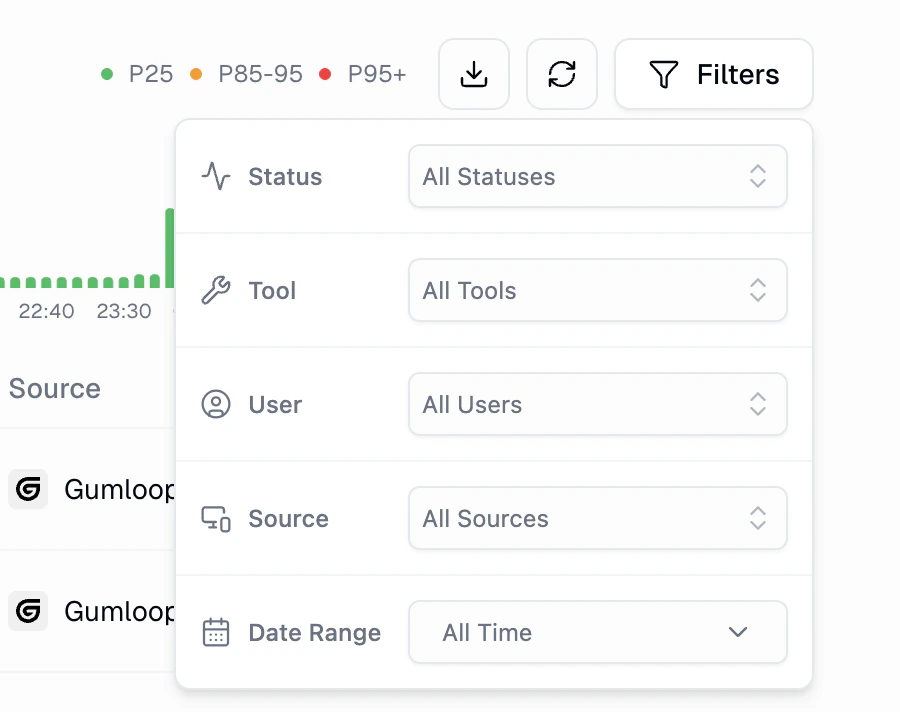
Filtering Activity
Click the Filters button in the top right to narrow down what you see. You can filter by:- Status: All Statuses, Success, Error, Permission Denied, or In Progress
- Server: Filter to a specific MCP server
- Tool: Filter to a specific tool name
- User: Filter to a specific user
- Source: Filter by where calls originated
- Date Range: All Time, Last 24 Hours, Last 7 Days, Last 30 Days, or a custom range
Exporting Activity Data
Click the download icon (next to the Refresh and Filters buttons) to export the current filtered view as a CSV file. This is useful for compliance reporting, sharing with your team, or doing deeper analysis in a spreadsheet.Server Detail View
When you click into a specific server from the activity table, you see the server detail page. This includes a summary of the server’s last 7 days of activity:- Total Calls: Total tool calls for this server
- Unique Users: Number of distinct users who made calls
- Error Rate: Percentage of calls that returned errors
- Avg Latency: Average response time
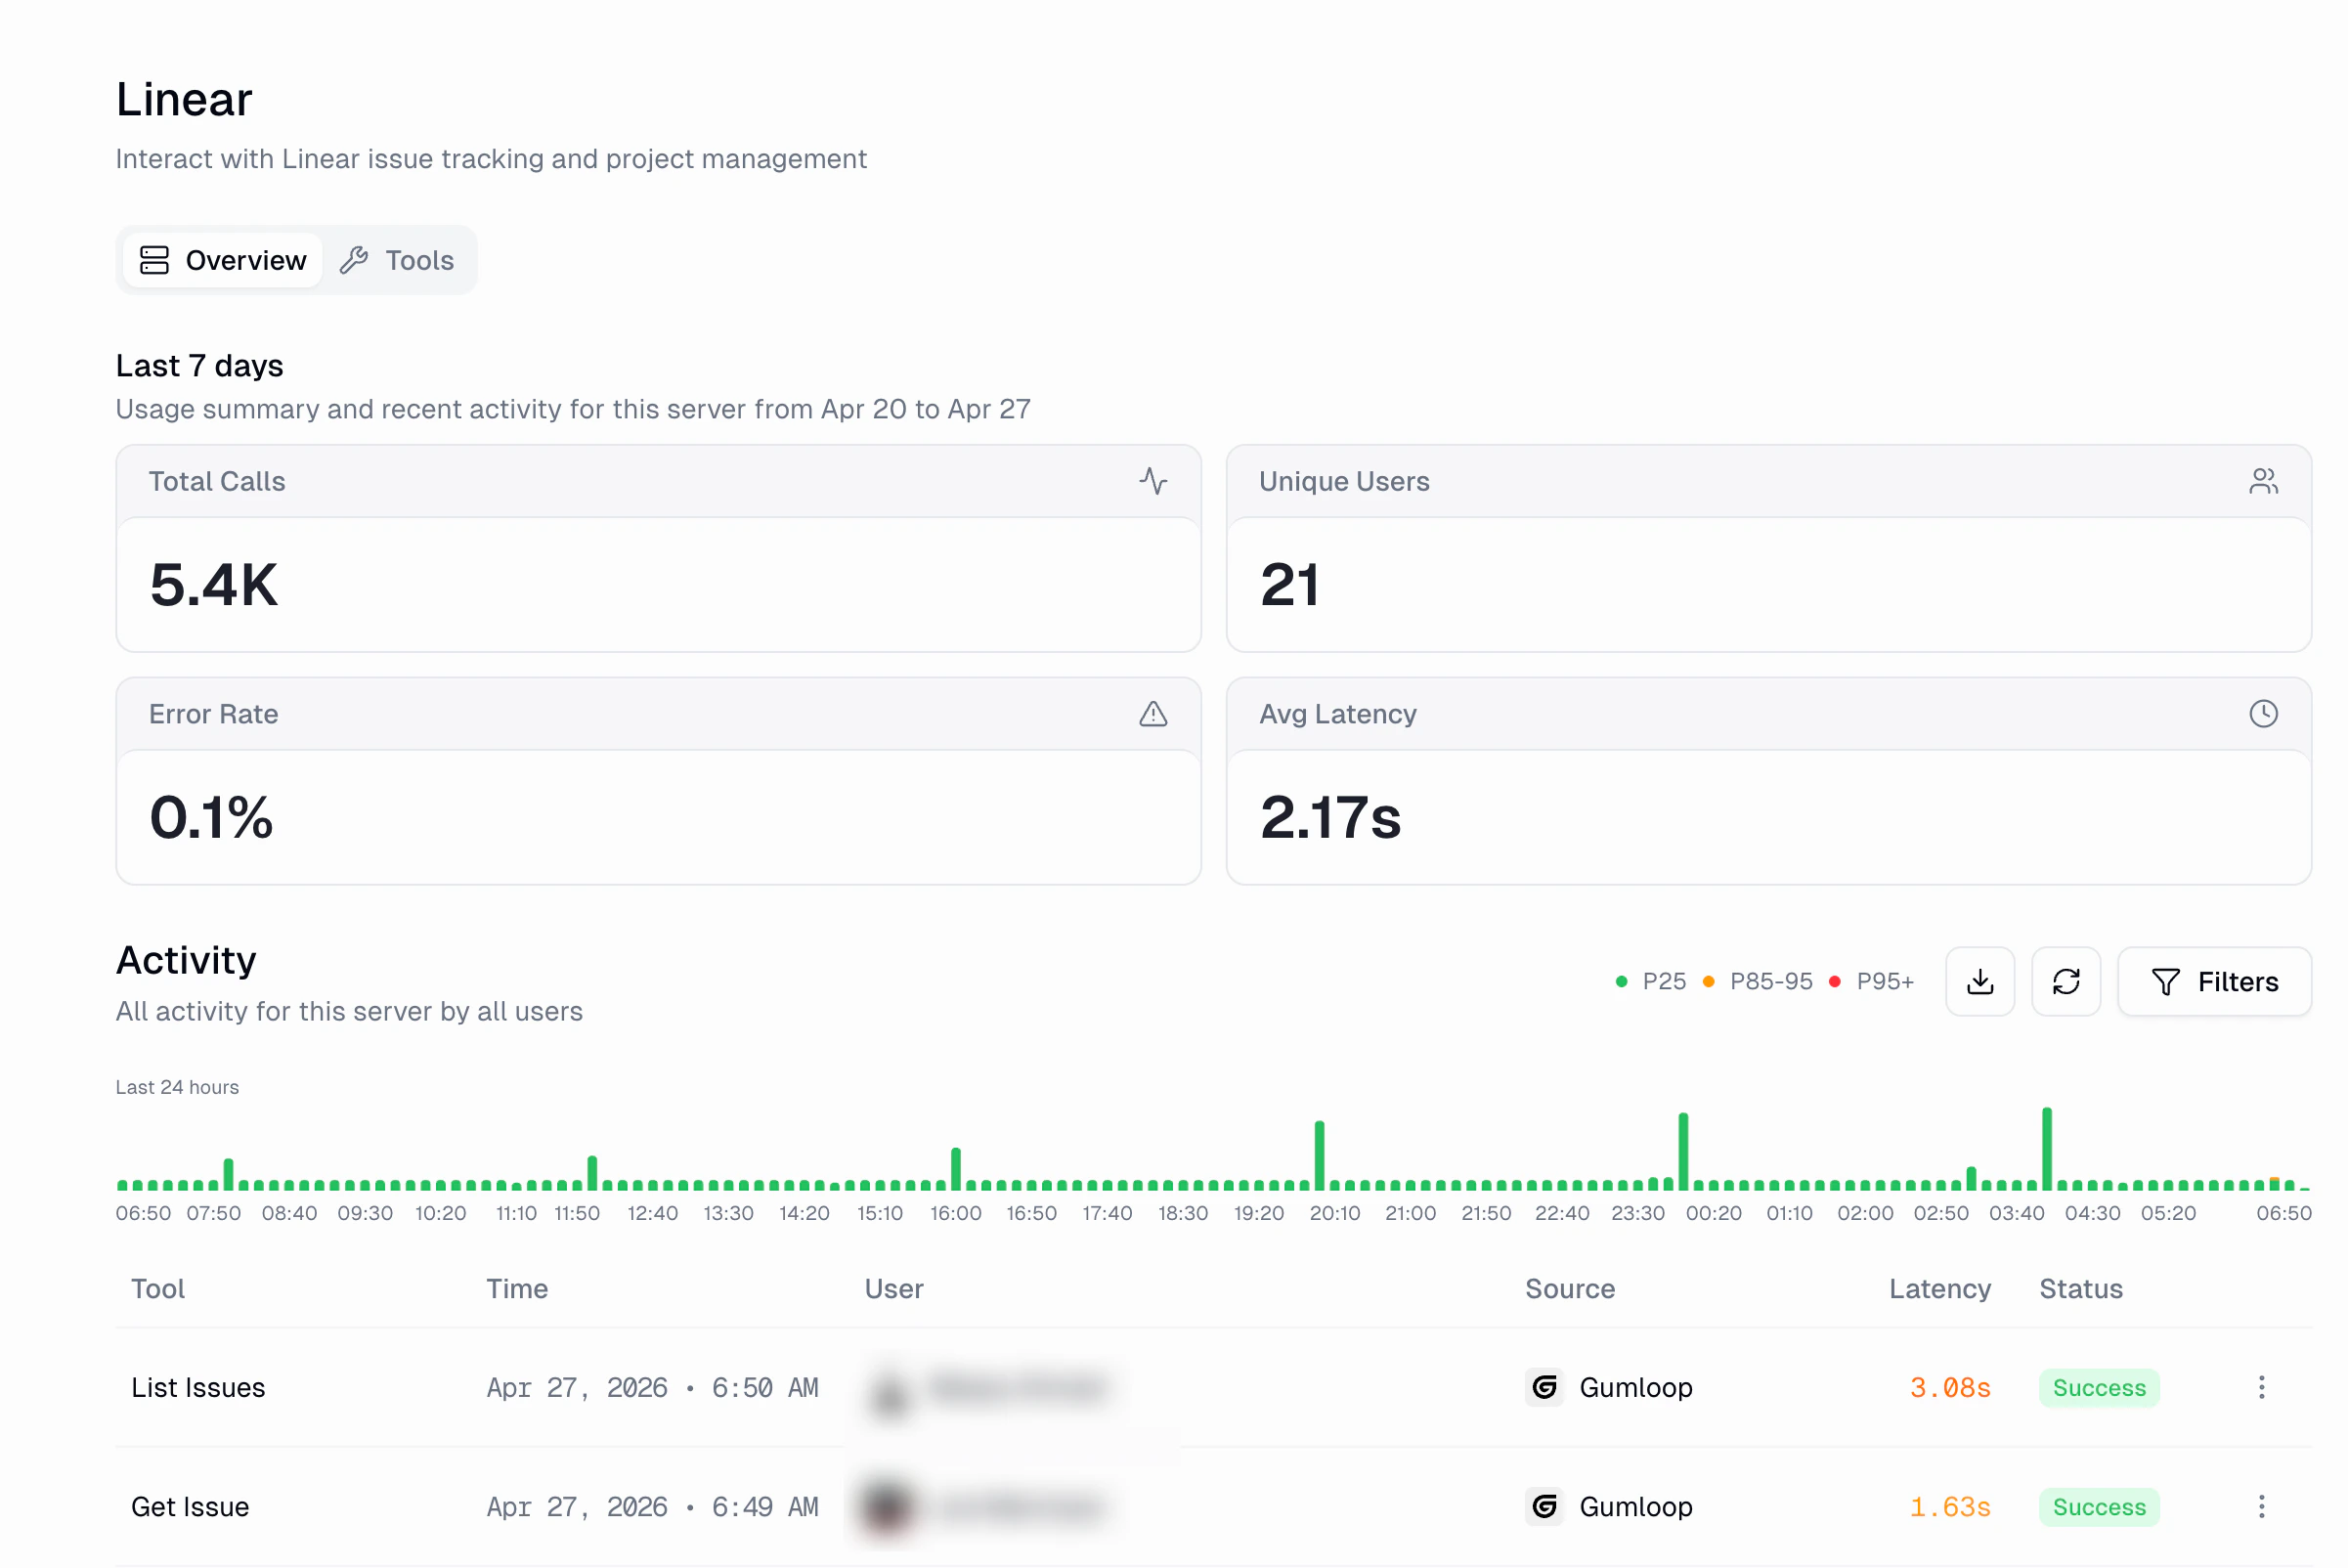
- Green (P25): Fast calls (25th percentile and below)
- Orange (P85-95): Moderately slow calls
- Red (P95+): The slowest calls
Tools & Access
The Tools tab on any server detail page shows every tool discovered on that server, along with a custom-role matrix. This lets you control exactly which custom roles can use which tools.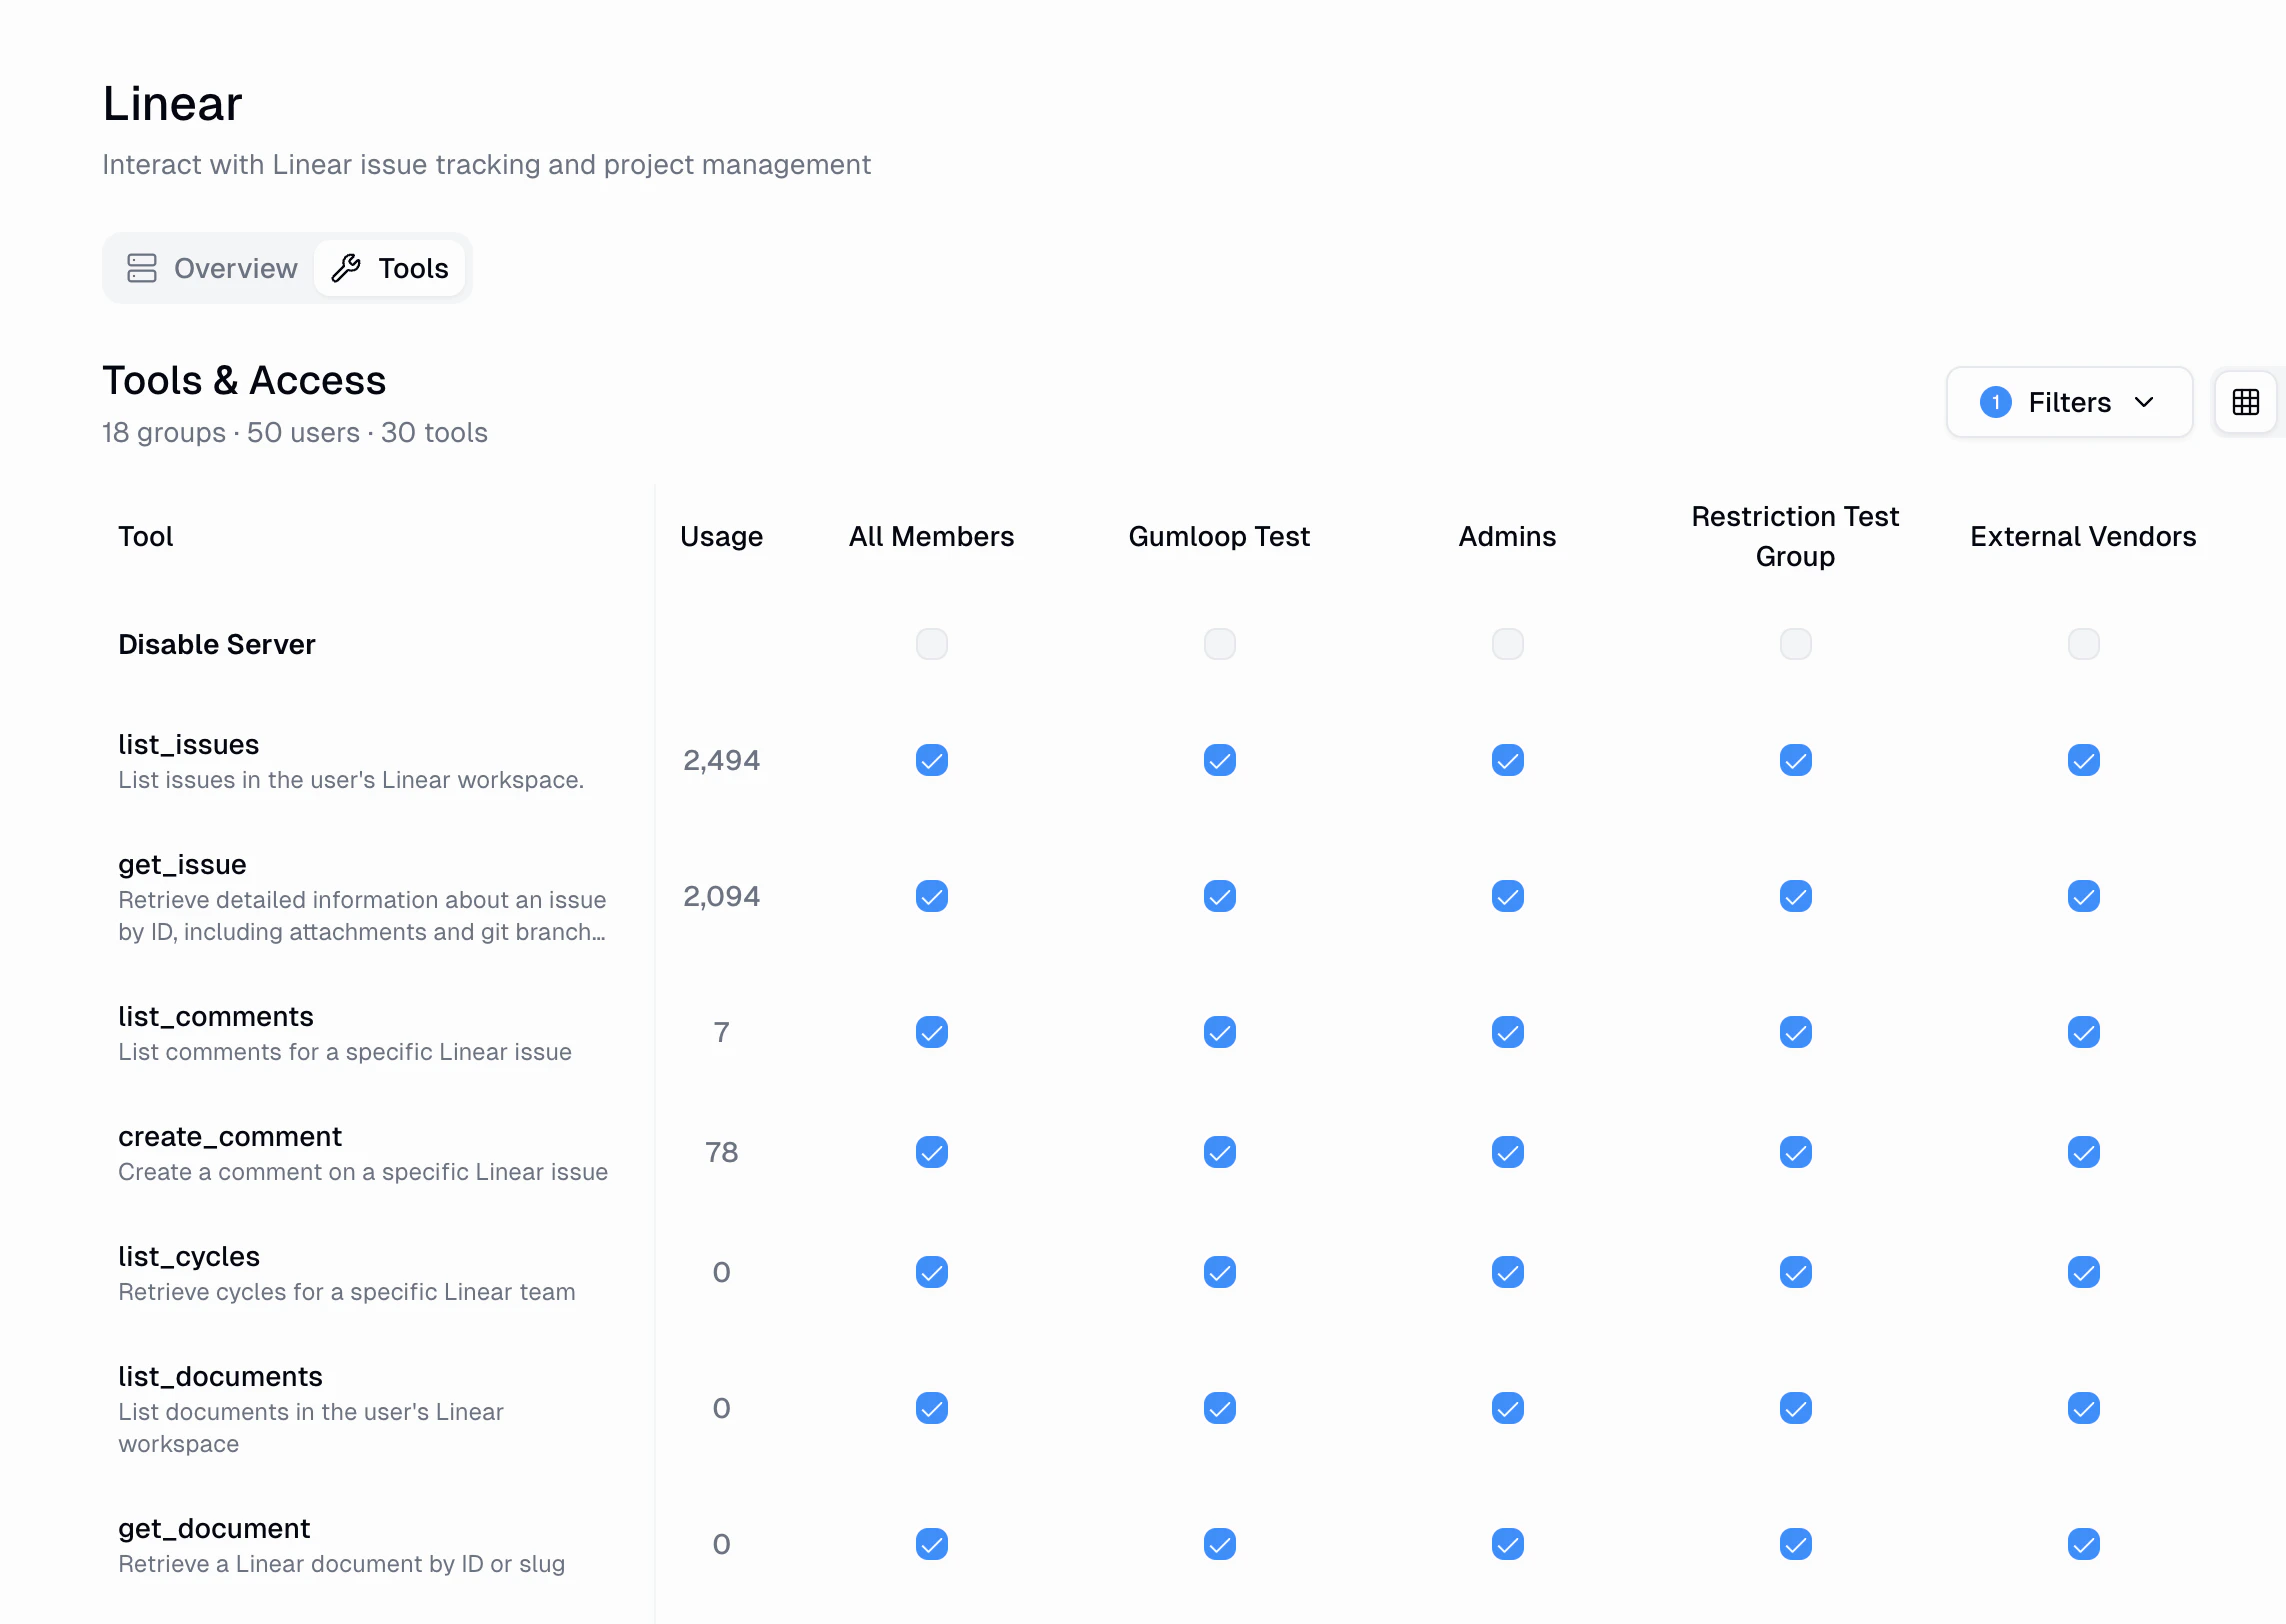
- Tool name and description
- Usage count: How many times the tool has been called
- Per-role toggles: Enable or disable the tool for each custom role
Scoped Analytics
If you are not an organization admin or manager, App Activity automatically scopes the view to show only your own activity. This means every user has access to their personal tool call history without being able to see other users’ data.FAQ
How far back does activity data go?
How far back does activity data go?
Activity data is available for the lifetime of your organization. Use the
Date Range filter to look at historical data beyond the default 24-hour
view.
Can I see activity for a specific agent or workflow?
Can I see activity for a specific agent or workflow?
Yes. Use the Source filter to narrow results to a specific origin, and
the User filter to find calls made by a particular user or agent.
What does 'Permission Denied' status mean?
What does 'Permission Denied' status mean?
A tool call with Permission Denied status was blocked by your
organization’s App Policies
or tool access settings. Check the Tools & Access tab on the relevant
server, or review your App Rules.
How is this different from Audit Logging?
How is this different from Audit Logging?
Audit Logging tracks administrative
actions across the platform (sign-ins, credential changes, team management,
etc.). App Activity specifically tracks MCP tool calls and integration
usage, giving you deeper visibility into what your AI agents and
automations are actually doing.