> ## Documentation Index
> Fetch the complete documentation index at: https://docs.gumloop.com/llms.txt
> Use this file to discover all available pages before exploring further.
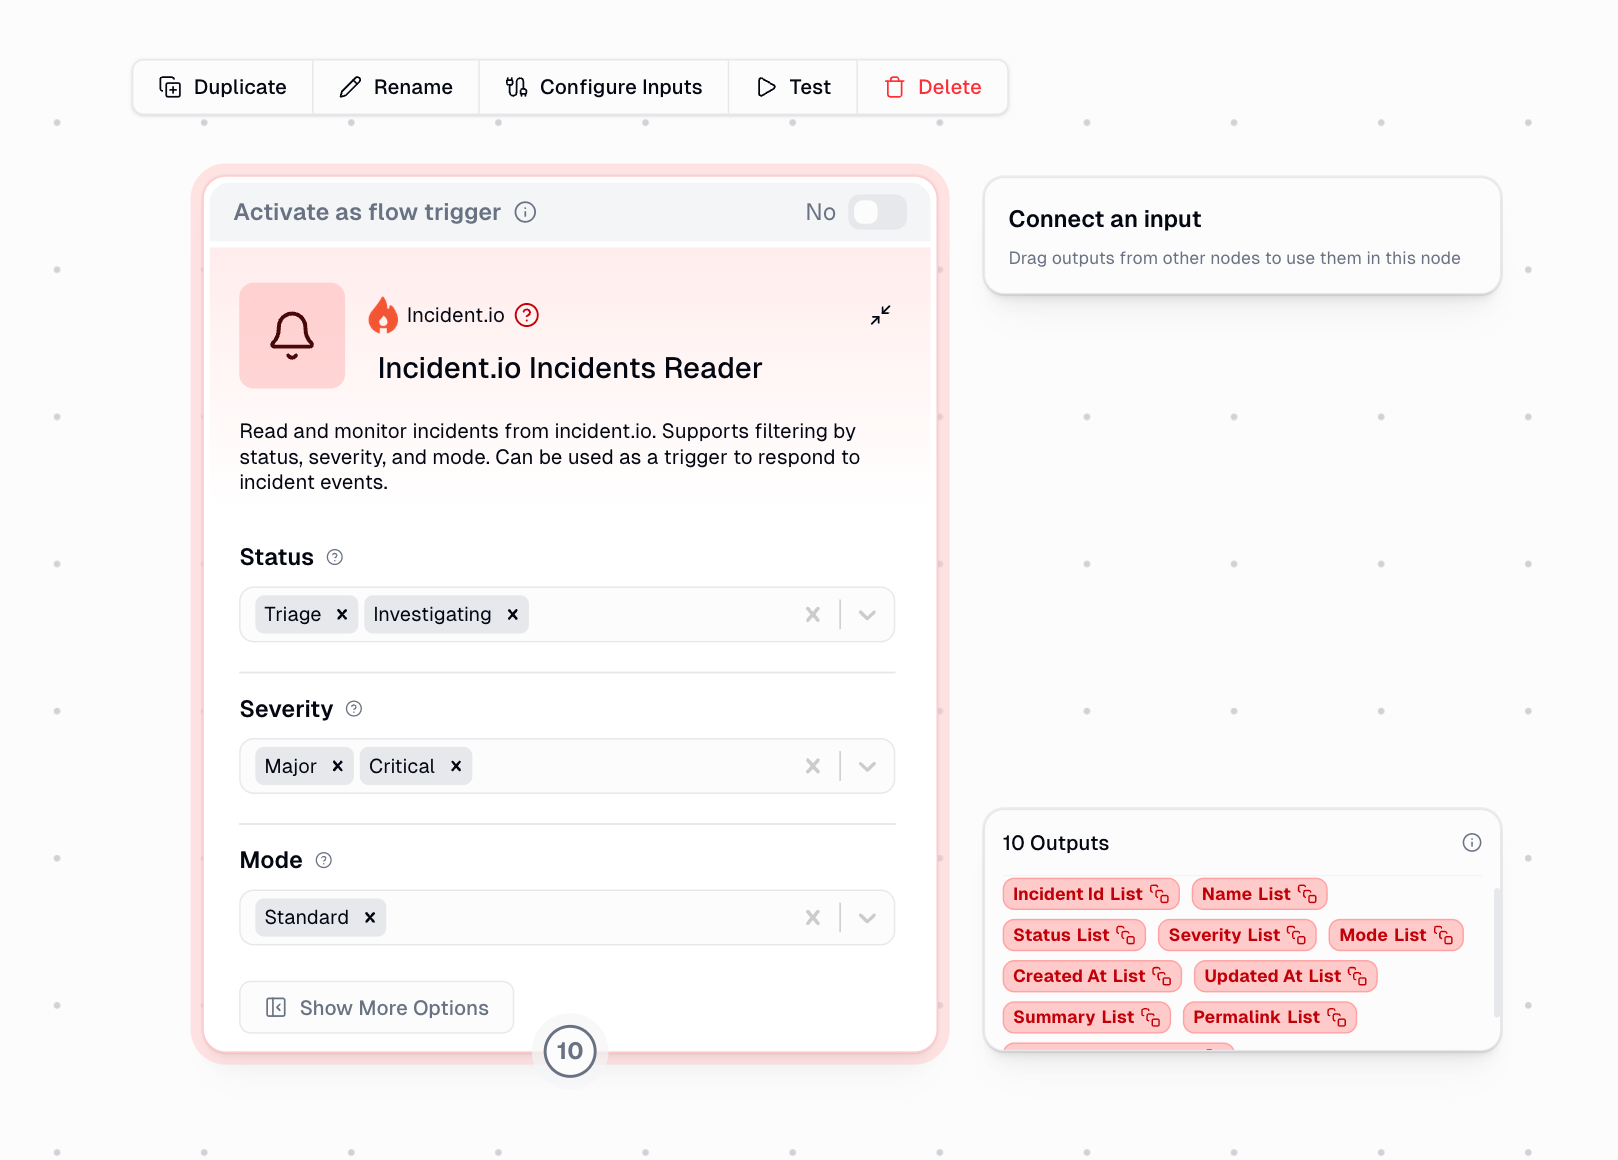
# Incident.io Incidents Reader
> Read and monitor incidents from incident.io with automated polling triggers
The Incident.io Incidents Reader connects to your incident.io workspace to retrieve and monitor incidents. Use it to fetch incident data manually or set up automated workflows that trigger when new incidents are detected.
## How It Works
This node operates in two modes:
Fetch incidents on-demand with custom filters. Returns all matching incidents as lists for reporting and analysis.
Automatically polls incident.io every 5 minutes for new incidents. Triggers your workflow when incidents are detected.
## Setup
Navigate to your incident.io settings and generate an API key with permissions to read incidents.
Search for `Incident.io` on the [Connectors page](https://www.gumloop.com/personal/connectors) and save the API key.
Set Status, Severity, or Mode filters to narrow down which incidents you want to retrieve.
Ensure your API key has sufficient permissions to read incidents via the incident.io v2 API.
## Configuration
### Filters
All filters support multiple selections and use case-insensitive matching:
Filter incidents by their current status:
* **Triage** - Incident is being assessed
* **Investigating** - Team is diagnosing the issue
* **Fixing** - Solution is being implemented
* **Monitoring** - Fix deployed, watching for stability
* **Closed** - Incident resolved
Filter by incident severity level:
* **Minor** - Low impact incidents
* **Major** - Significant business impact
* **Critical** - Severe, immediate attention required
Filter by incident type:
* **Standard** - Regular production incidents
* **Retrospective** - Post-incident analysis
* **Tutorial** - Training incidents
* **Test** - Testing workflows
## Outputs
The node provides comprehensive incident data. Output format depends on the mode:
| Output Field | Description | Source Field |
| ---------------- | -------------------------------------------- | ---------------------- |
| Incident ID | Unique identifier | `id` |
| Name | Incident title | `name` |
| Status | Current status (Triage, Investigating, etc.) | `incident_status.name` |
| Severity | Severity level (Minor, Major, Critical) | `severity.name` |
| Mode | Incident type | `mode` |
| Created At | Creation timestamp (ISO format) | `created_at` |
| Updated At | Last update timestamp (ISO format) | `updated_at` |
| Summary | Incident description | `summary` |
| Permalink | Direct link to incident | `permalink` |
| Slack Channel ID | Associated Slack channel | `slack_channel_id` |
**Manual mode** returns arrays (lists) for each field. **Trigger mode** returns single values for each detected incident.
## Using as a Trigger
When enabled as a trigger, the node automatically monitors for new incidents:
* Checks incident.io every 5 minutes
* Applies Severity and Mode filters (Status is not used in polling)
* Tracks processed incidents to avoid duplicates
* Fires workflow once per new incident detected
The trigger maintains a list of processed incident IDs in its state. Only newly detected incidents trigger the workflow. Clearing the trigger state or changing filters may cause previously seen incidents to be treated as new.
### Common Trigger Use Cases
Automatically post to Slack when critical incidents are created
Create Jira or Linear tickets for new high-priority incidents
Send email or SMS alerts when specific types of incidents occur
Update real-time dashboards when incident status changes
**Example trigger configuration:**
```text theme={"dark"}
Severity: Major, Critical
Mode: Standard
```
This will trigger your workflow for every new Major or Critical incident in Standard mode.
## Example Workflows
Run the node manually (no trigger) to fetch all incidents, filter by status (Investigating, Fixing), and pass the arrays to a reporting node. Perfect for daily standups or retrospectives.
Enable as a trigger with Severity set to Critical. Connect to nodes that post to Slack, create a PagerDuty alert, and log to your incident tracking system.
Fetch closed incidents weekly, extract patterns from summaries using AI, and generate insights about recurring issues.
## Error Handling
The node provides clear error messages for common issues:
| Error | Cause | Solution |
| ------------------------------ | ----------------------------------- | -------------------------------------------------------- |
| No incidents found | incident.io returned zero incidents | Check your API permissions and ensure incidents exist |
| No incidents match filters | All incidents filtered out | Adjust your Status, Severity, or Mode filters |
| Failed to connect (HTTP error) | API request failed | Verify your API key and check incident.io service status |
| Empty response | API returned no data | Contact incident.io support if persistent |
| Invalid JSON | Response parsing failed | Check API compatibility or contact support |
In trigger mode, if no event is found in the webhook input, ensure the trigger is properly configured and the polling mechanism is active.
## Tips
Combine multiple filters to narrow results. For example, Status = "Investigating" + Severity = "Critical" gives you high-priority active incidents.
When using as a trigger, start with broader filters and refine based on workflow volume. Too many triggers can overwhelm downstream systems.
The Permalink output provides direct links to incidents in incident.io - perfect for including in notifications or tickets.