> ## Documentation Index
> Fetch the complete documentation index at: https://docs.gumloop.com/llms.txt
> Use this file to discover all available pages before exploring further.
# Organization Insights
> Dashboards and an analytics agent for adoption, credit spend, and outcomes across your organization
Insights is the reporting home for your organization. It combines **prebuilt dashboards** for adoption and credit spend with an **analytics agent** you can ask about that same usage data in plain language — both on the same page at [Settings > Organization > Insights](https://www.gumloop.com/settings/organization/insights).
 ## At a glance
Nine tabs covering credits, agents, teams, models, skills, tasks, artifacts, connectors, and a free-form explorer
Ask questions in natural language and get tables, charts, and CSV exports — in the app or in Slack
Schedule a weekly or monthly digest to email and Slack
Click any agent, team, model, task, or connector to see the detail behind the number
**Who can see it**: Insights is an Enterprise feature, open to members with the **Admin**, **Manager**, or **Analytics** [organization role](/core-concepts/organization_user_roles). See the [FAQ](#faq) for what each role can see and how to grant access.
### Where to start
Everything on the page — every KPI, chart, and table — follows the range in the toolbar. It defaults to the last 30 days.
Read the digest at the top for the headline number, then check the spend trend and the leaderboards for what drove it.
Agents, Teams, and Models explain cost; Skills, Tasks, Artifacts, and Connectors explain adoption. Select any row to see the detail behind it.
Open the **Agent** rail for ad-hoc questions and exports, or use **Explorer** to slice usage yourself.
Set up an [Impact Report](#impact-reports) so the summary arrives in email or Slack instead of you checking the page.
## Page anatomy
Every tab shares the same controls at the top of the page:
| Control | What it does |
| ----------------- | --------------------------------------------------------------------------------------------------------------------------------------------------------------------------------------- |
| **Date range** | Sets the period for every metric on the page. Defaults to the last 30 days; other presets are Today, Last 7 days, Month to date, Last 3 months, and Last month, or pick a custom range. |
| **Impact Report** | Opens the scheduled digest settings for the organization. See [Impact Reports](#impact-reports). |
| **Agent** | Opens the analytics agent in a rail beside the dashboard. See [Ask the analytics agent](#ask-the-analytics-agent). |
| **Tabs** | Overview, Agents, Teams, Models, Skills, Tasks, Artifacts, Connectors, Explorer. |
## At a glance
Nine tabs covering credits, agents, teams, models, skills, tasks, artifacts, connectors, and a free-form explorer
Ask questions in natural language and get tables, charts, and CSV exports — in the app or in Slack
Schedule a weekly or monthly digest to email and Slack
Click any agent, team, model, task, or connector to see the detail behind the number
**Who can see it**: Insights is an Enterprise feature, open to members with the **Admin**, **Manager**, or **Analytics** [organization role](/core-concepts/organization_user_roles). See the [FAQ](#faq) for what each role can see and how to grant access.
### Where to start
Everything on the page — every KPI, chart, and table — follows the range in the toolbar. It defaults to the last 30 days.
Read the digest at the top for the headline number, then check the spend trend and the leaderboards for what drove it.
Agents, Teams, and Models explain cost; Skills, Tasks, Artifacts, and Connectors explain adoption. Select any row to see the detail behind it.
Open the **Agent** rail for ad-hoc questions and exports, or use **Explorer** to slice usage yourself.
Set up an [Impact Report](#impact-reports) so the summary arrives in email or Slack instead of you checking the page.
## Page anatomy
Every tab shares the same controls at the top of the page:
| Control | What it does |
| ----------------- | --------------------------------------------------------------------------------------------------------------------------------------------------------------------------------------- |
| **Date range** | Sets the period for every metric on the page. Defaults to the last 30 days; other presets are Today, Last 7 days, Month to date, Last 3 months, and Last month, or pick a custom range. |
| **Impact Report** | Opens the scheduled digest settings for the organization. See [Impact Reports](#impact-reports). |
| **Agent** | Opens the analytics agent in a rail beside the dashboard. See [Ask the analytics agent](#ask-the-analytics-agent). |
| **Tabs** | Overview, Agents, Teams, Models, Skills, Tasks, Artifacts, Connectors, Explorer. |
 The tab, date range, and any selected agent or team live in the URL, so you can bookmark or share the exact view you are looking at.
***
## The tabs
### Overview
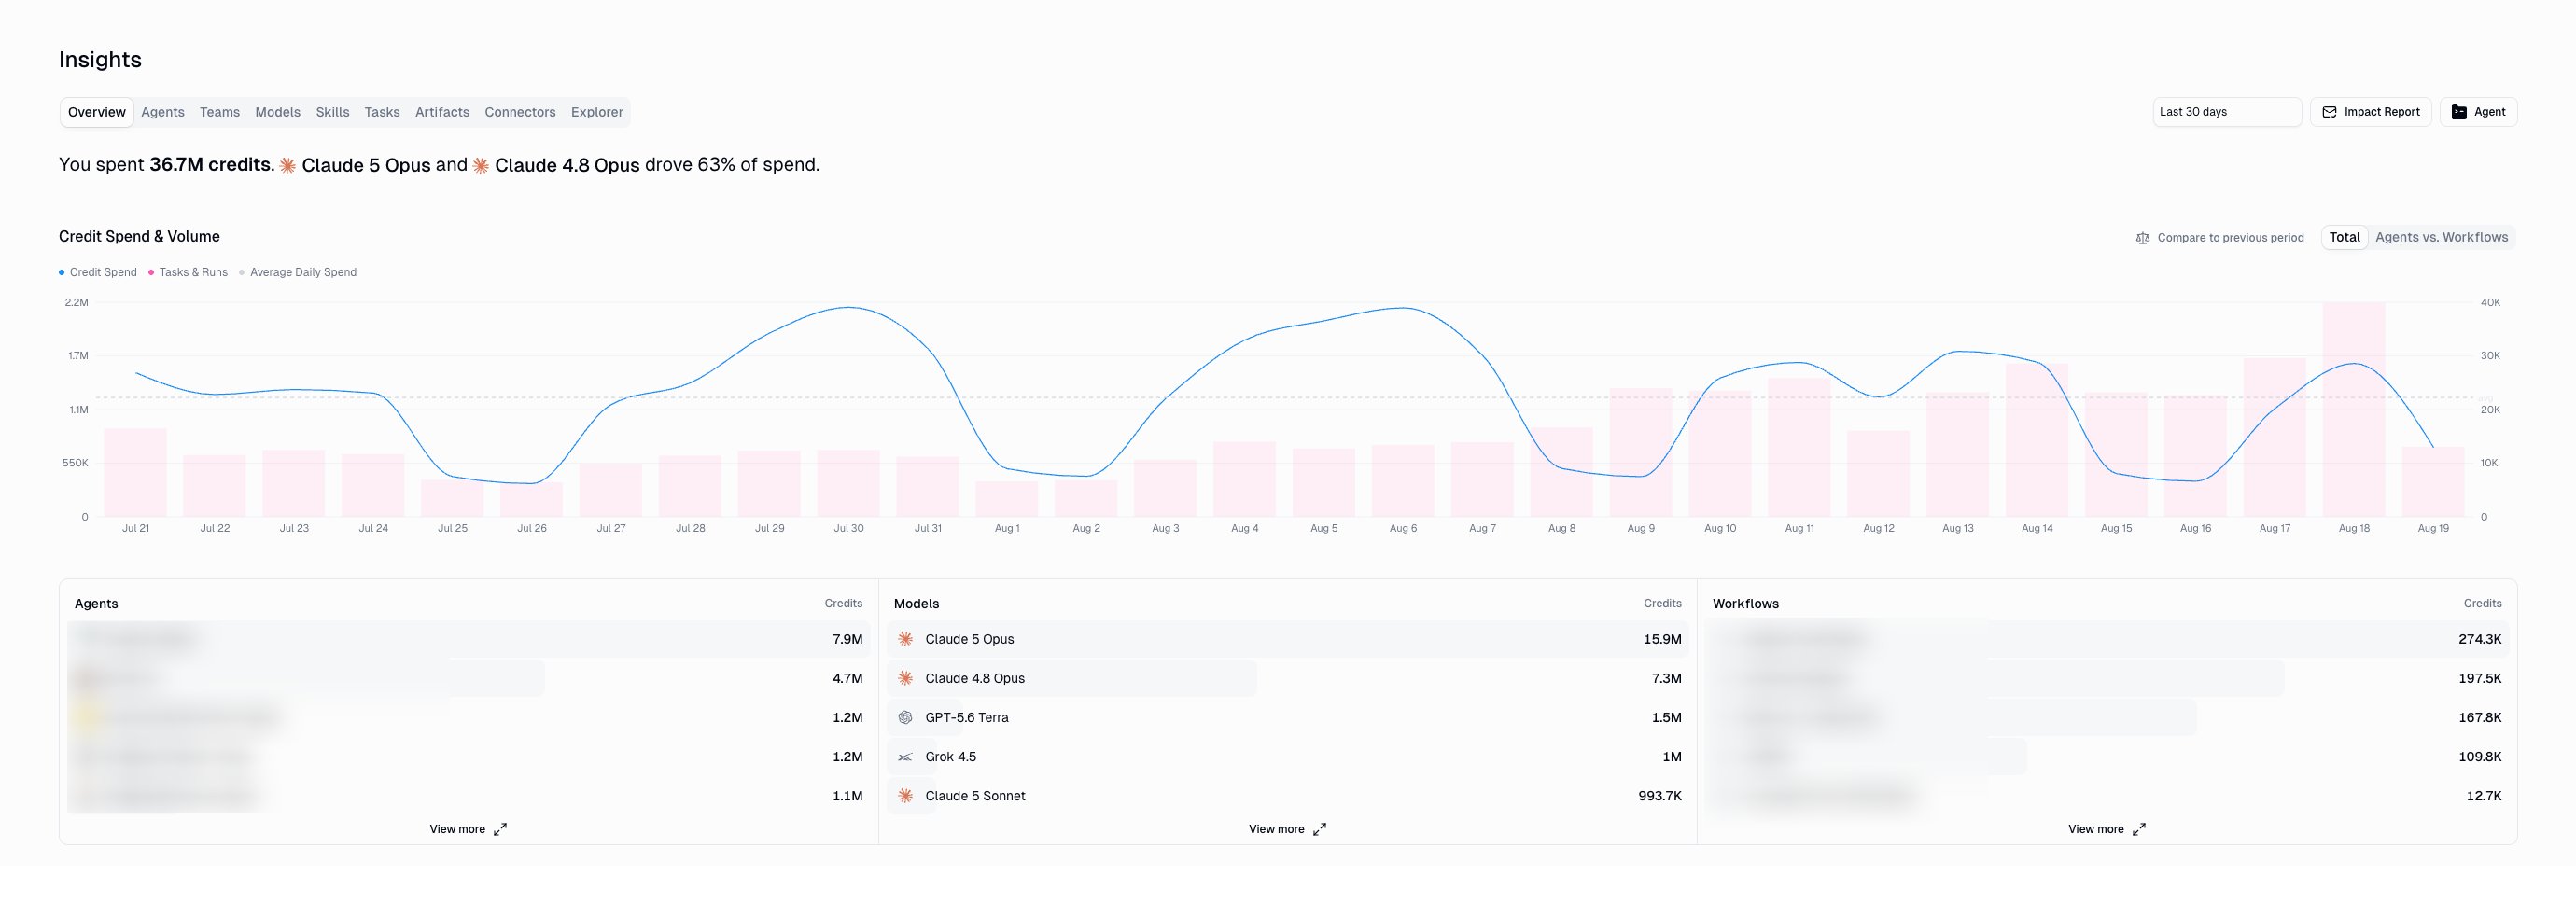
The starting point: how much you spent, where it went, and who drove it.
* A plain-language digest of credits spent in the period, with the models that consumed most of it
* **Credit spend and volume** over time, with an optional **compare to previous period** toggle
* Leaderboards for **top agents**, **top models**, and **top workflows**
* A per-member table of agent tasks, workflow runs, and credits
The tab, date range, and any selected agent or team live in the URL, so you can bookmark or share the exact view you are looking at.
***
## The tabs
### Overview
The starting point: how much you spent, where it went, and who drove it.
* A plain-language digest of credits spent in the period, with the models that consumed most of it
* **Credit spend and volume** over time, with an optional **compare to previous period** toggle
* Leaderboards for **top agents**, **top models**, and **top workflows**
* A per-member table of agent tasks, workflow runs, and credits
 ### Agents
Every agent in the organization with its usage and cost side by side — team, owner, model, tasks, credits, credits per task, how many members use it, and when it was last active. Search and filter to narrow the list.
### Agents
Every agent in the organization with its usage and cost side by side — team, owner, model, tasks, credits, credits per task, how many members use it, and when it was last active. Search and filter to narrow the list.
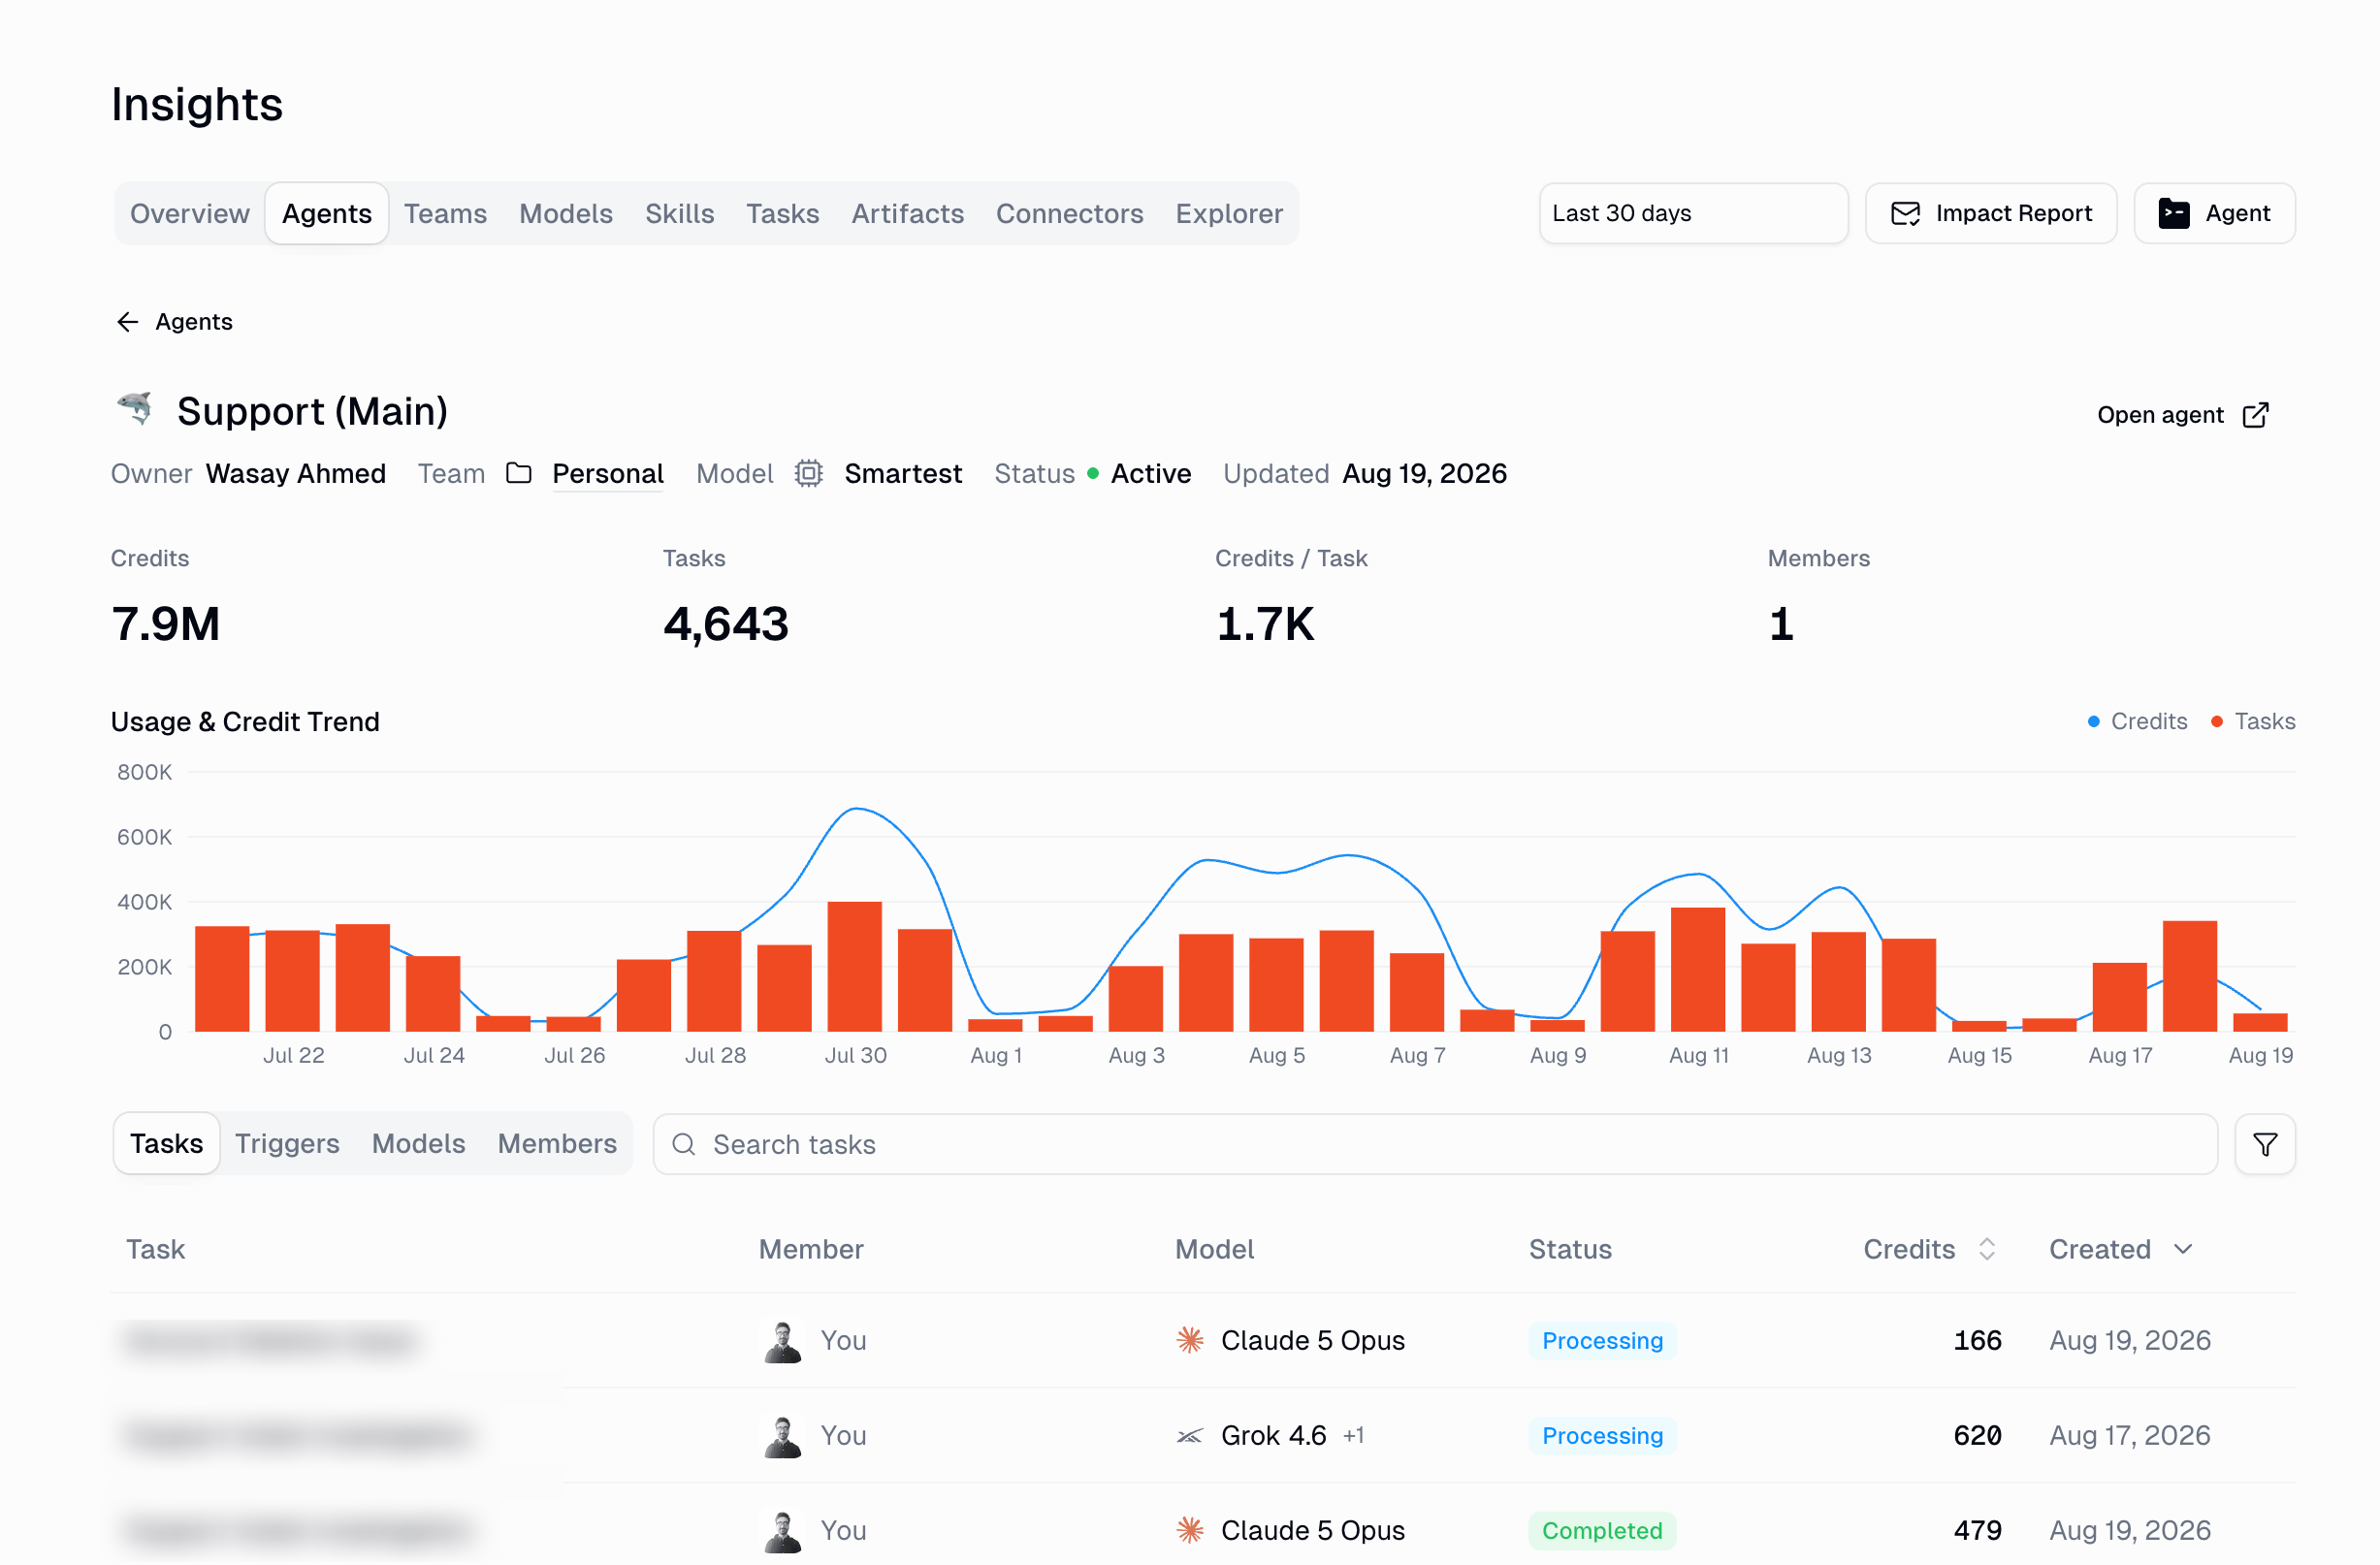
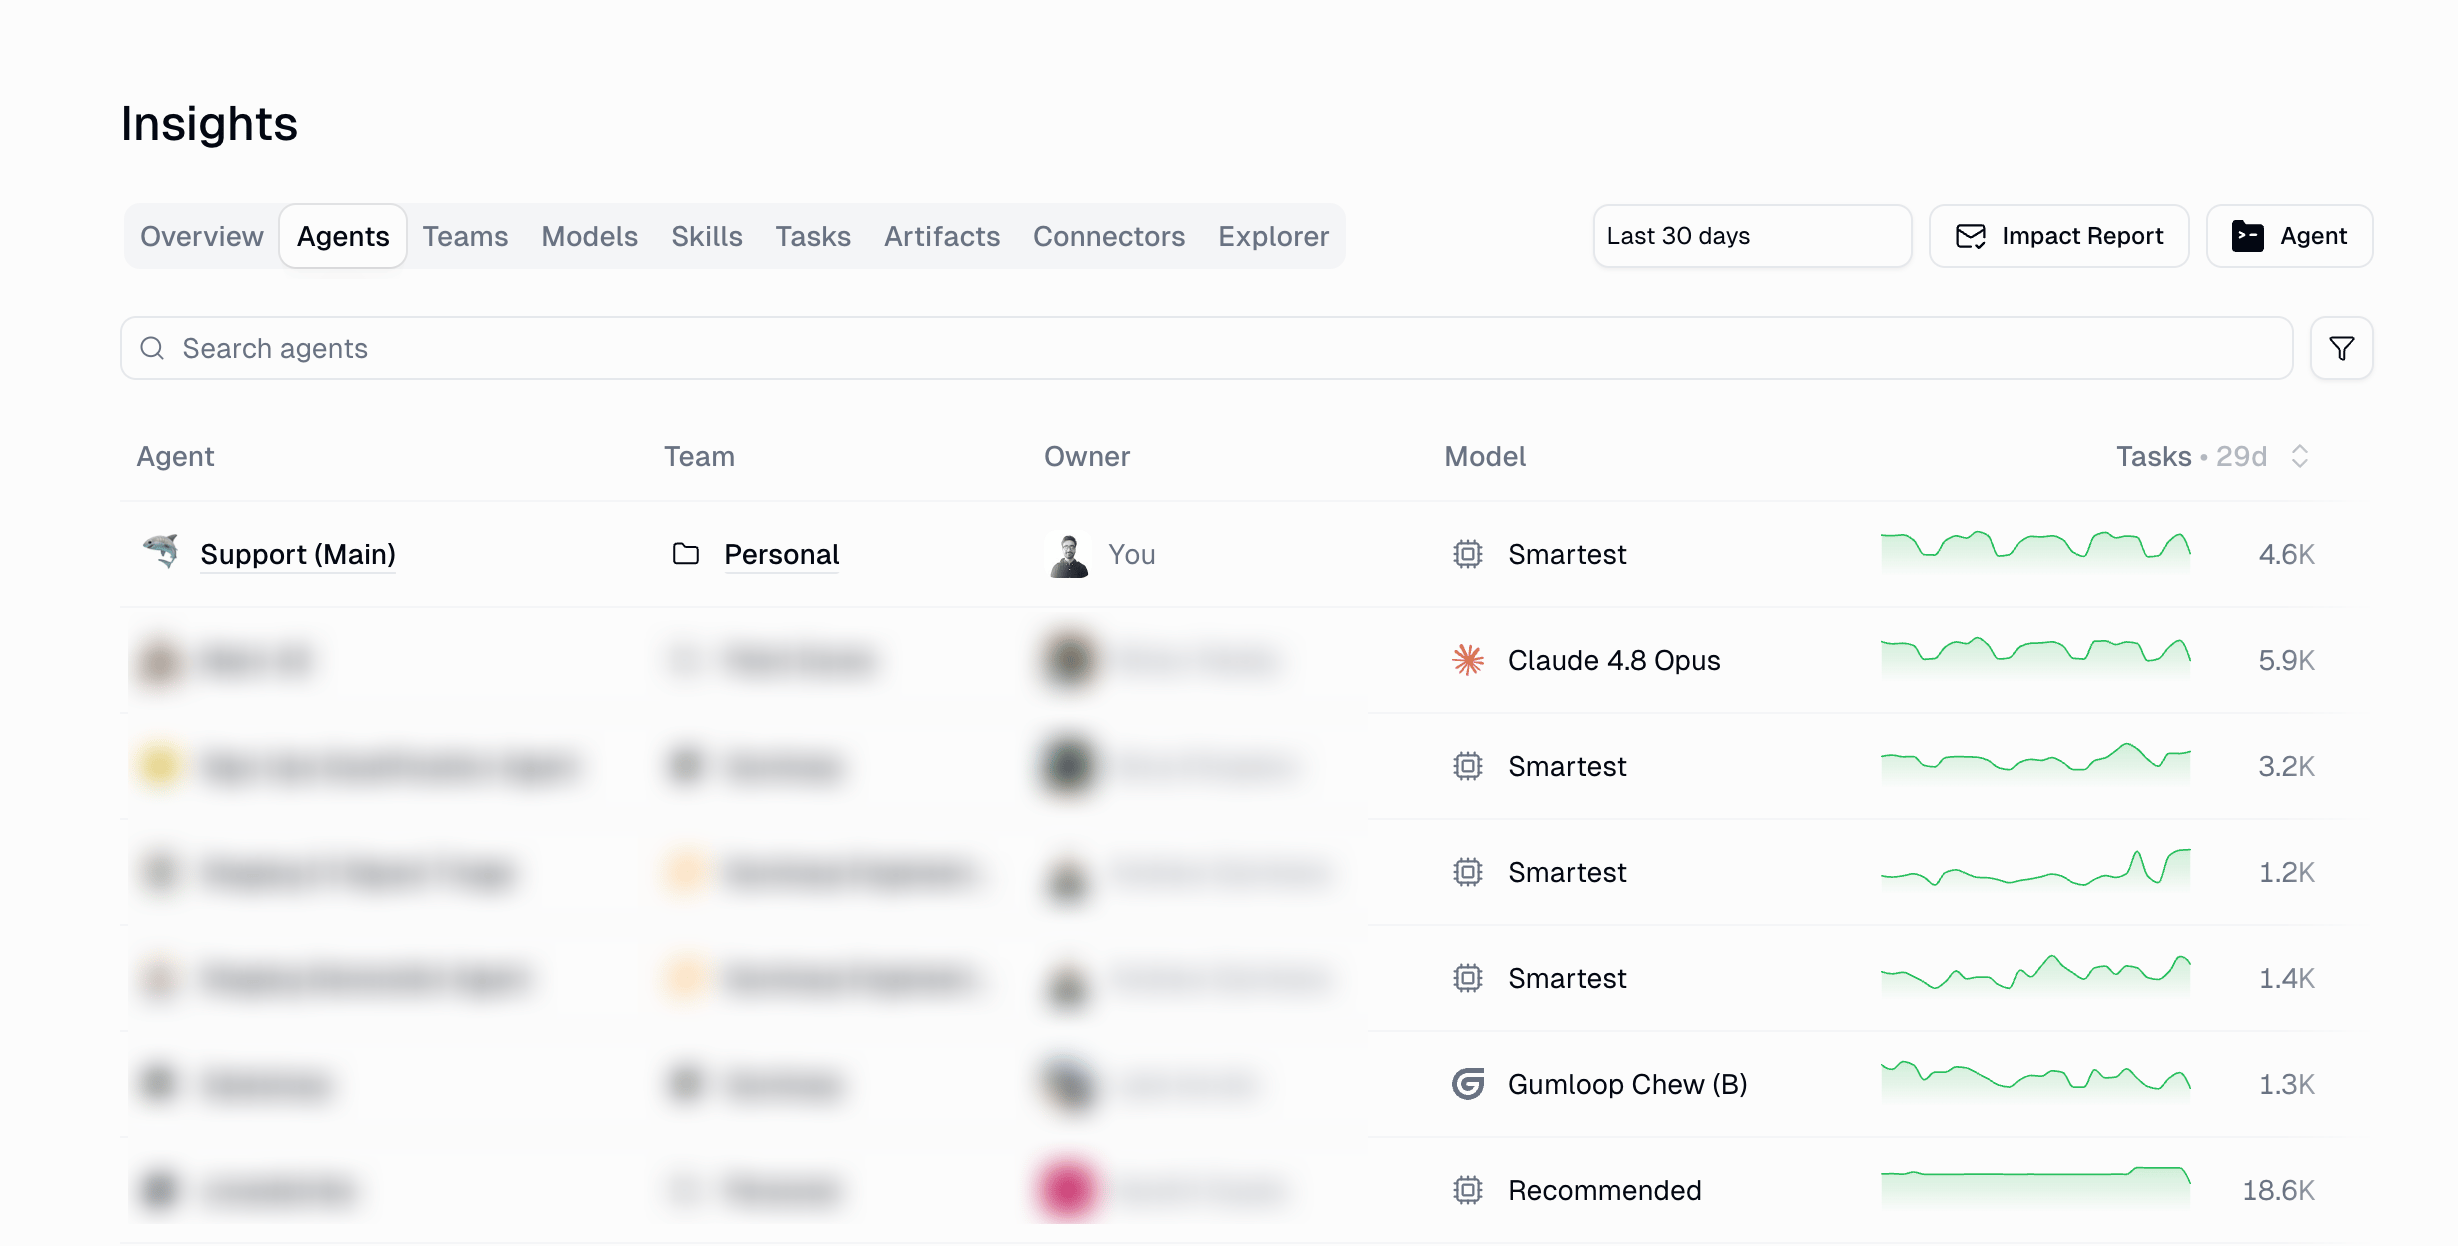 Select an agent to open its detail view: headline metrics, a usage and credit trend, and breakdowns of its tasks, triggers, models, and members.
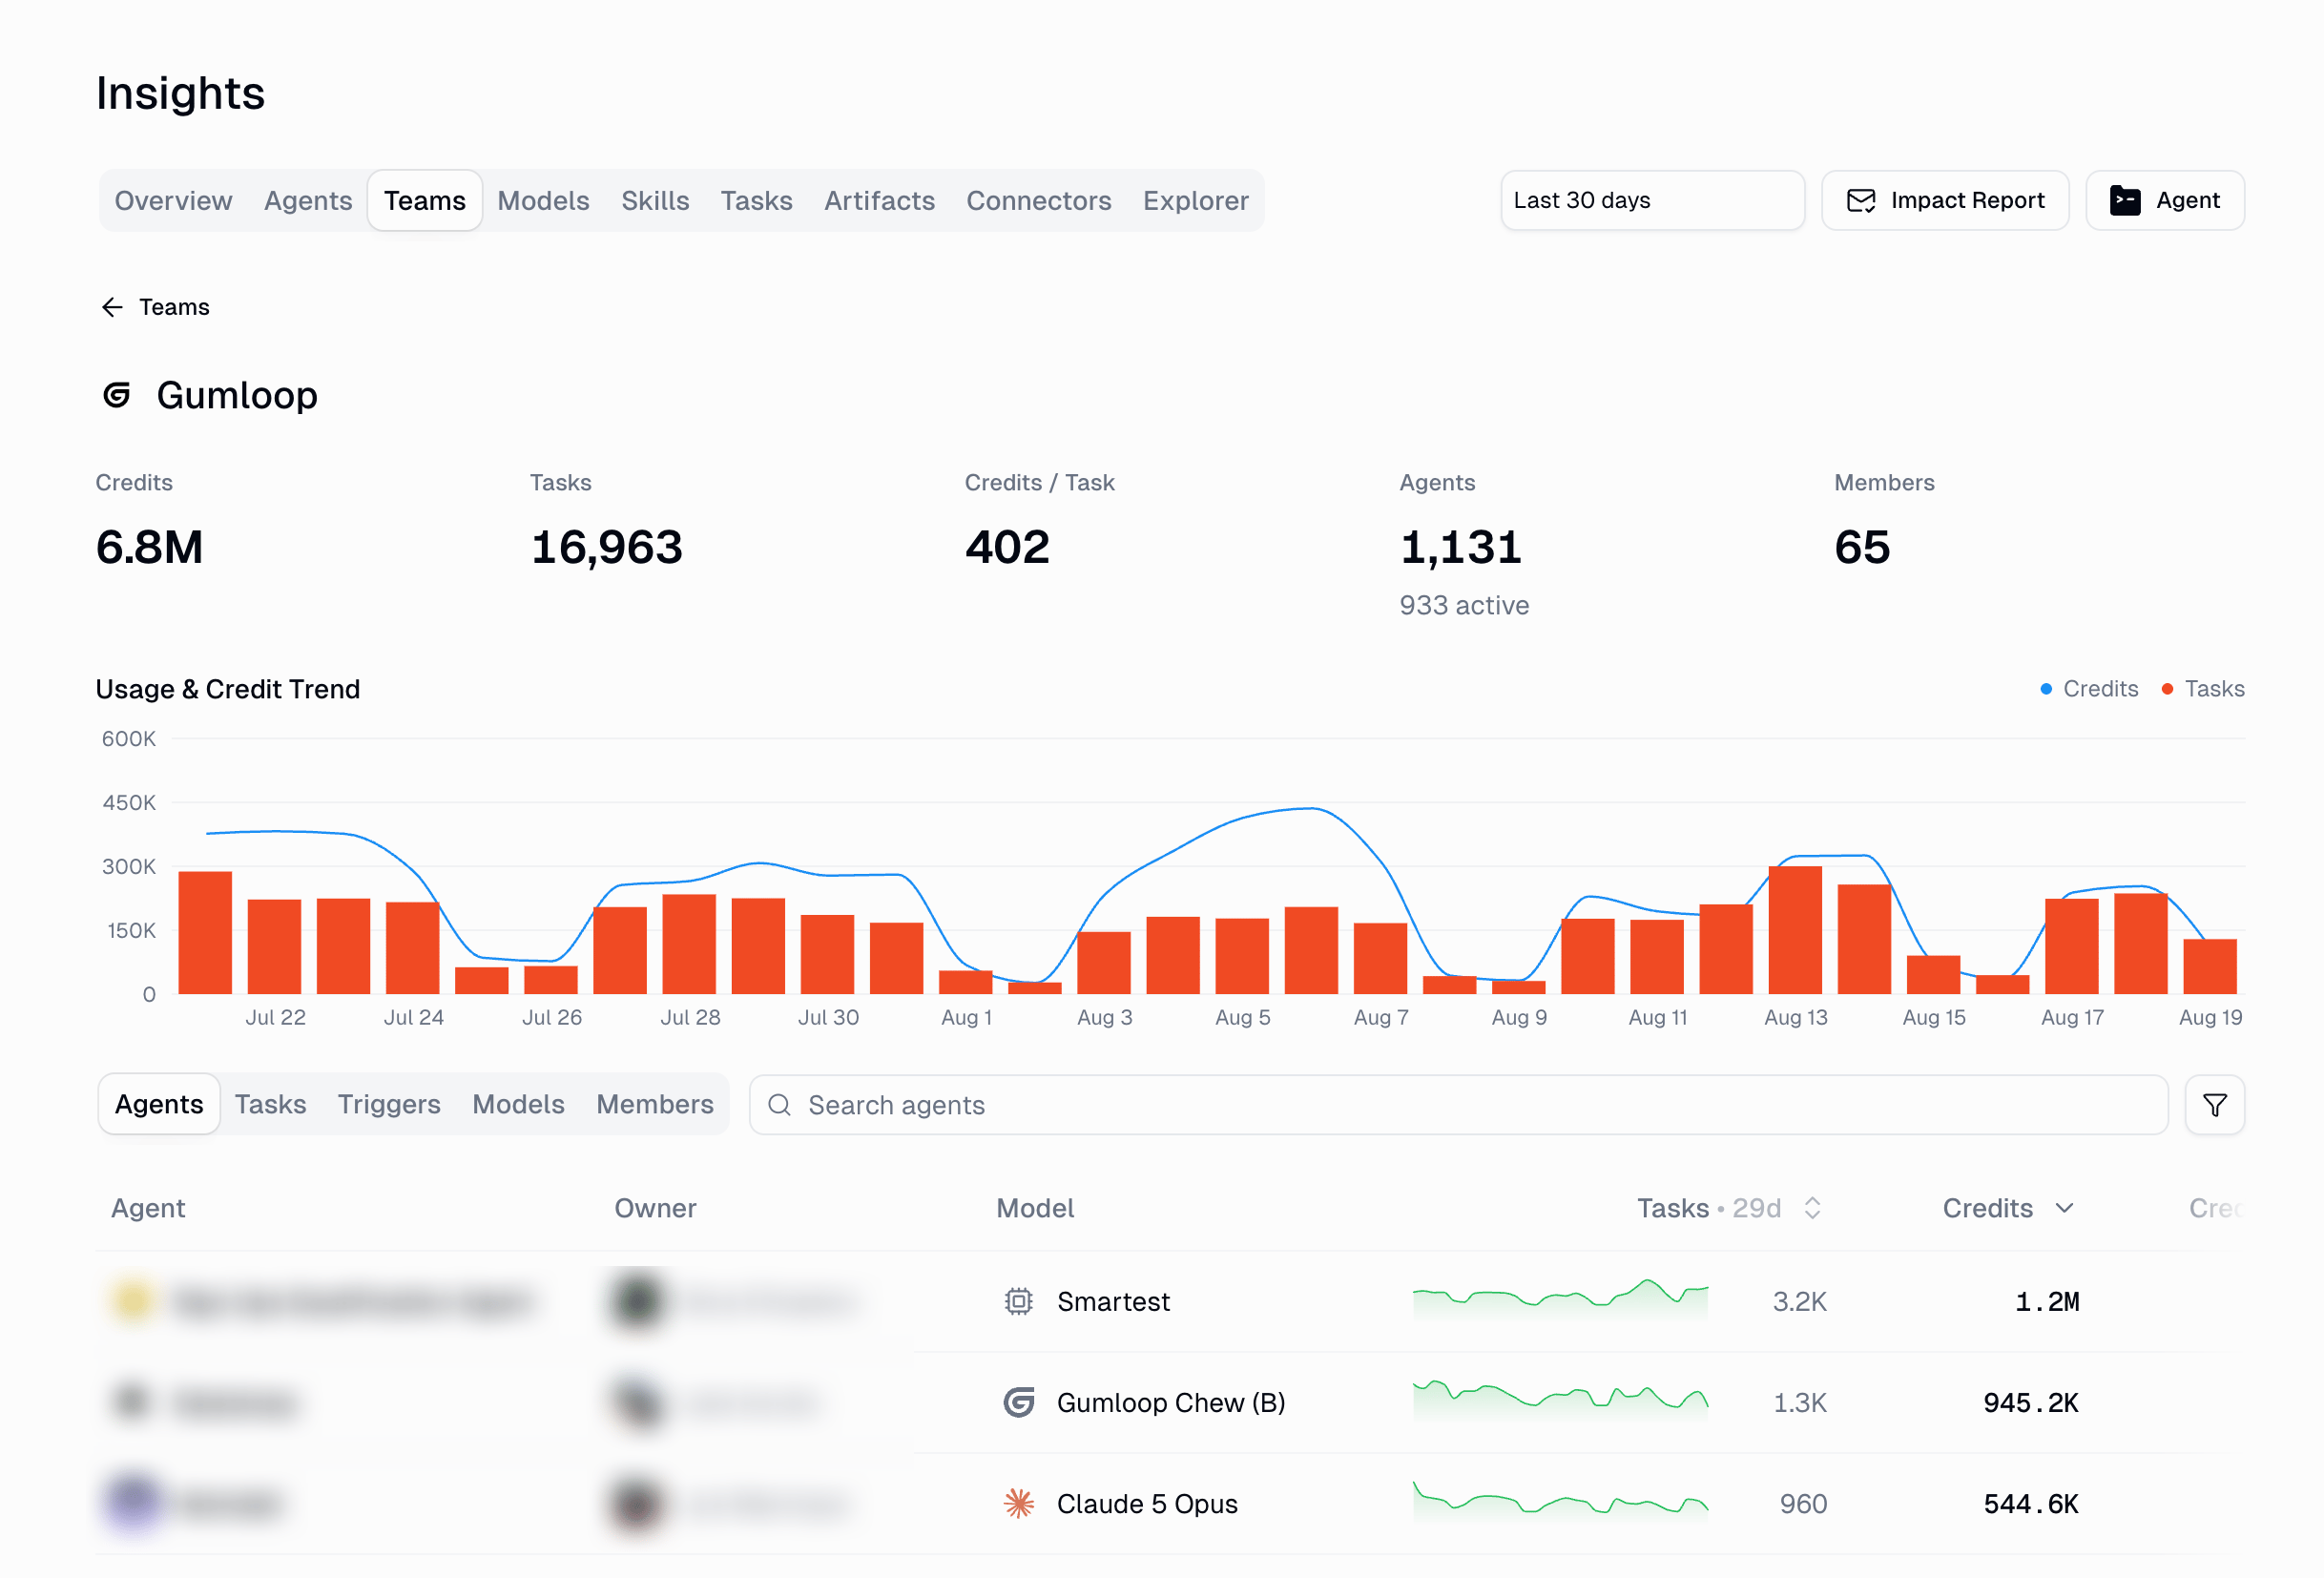
 ### Teams
The same view one level up. Compare [teams](/core-concepts/teams) by members, agents, tasks, credits, and credits per task to see which parts of the org are getting value.
### Teams
The same view one level up. Compare [teams](/core-concepts/teams) by members, agents, tasks, credits, and credits per task to see which parts of the org are getting value.
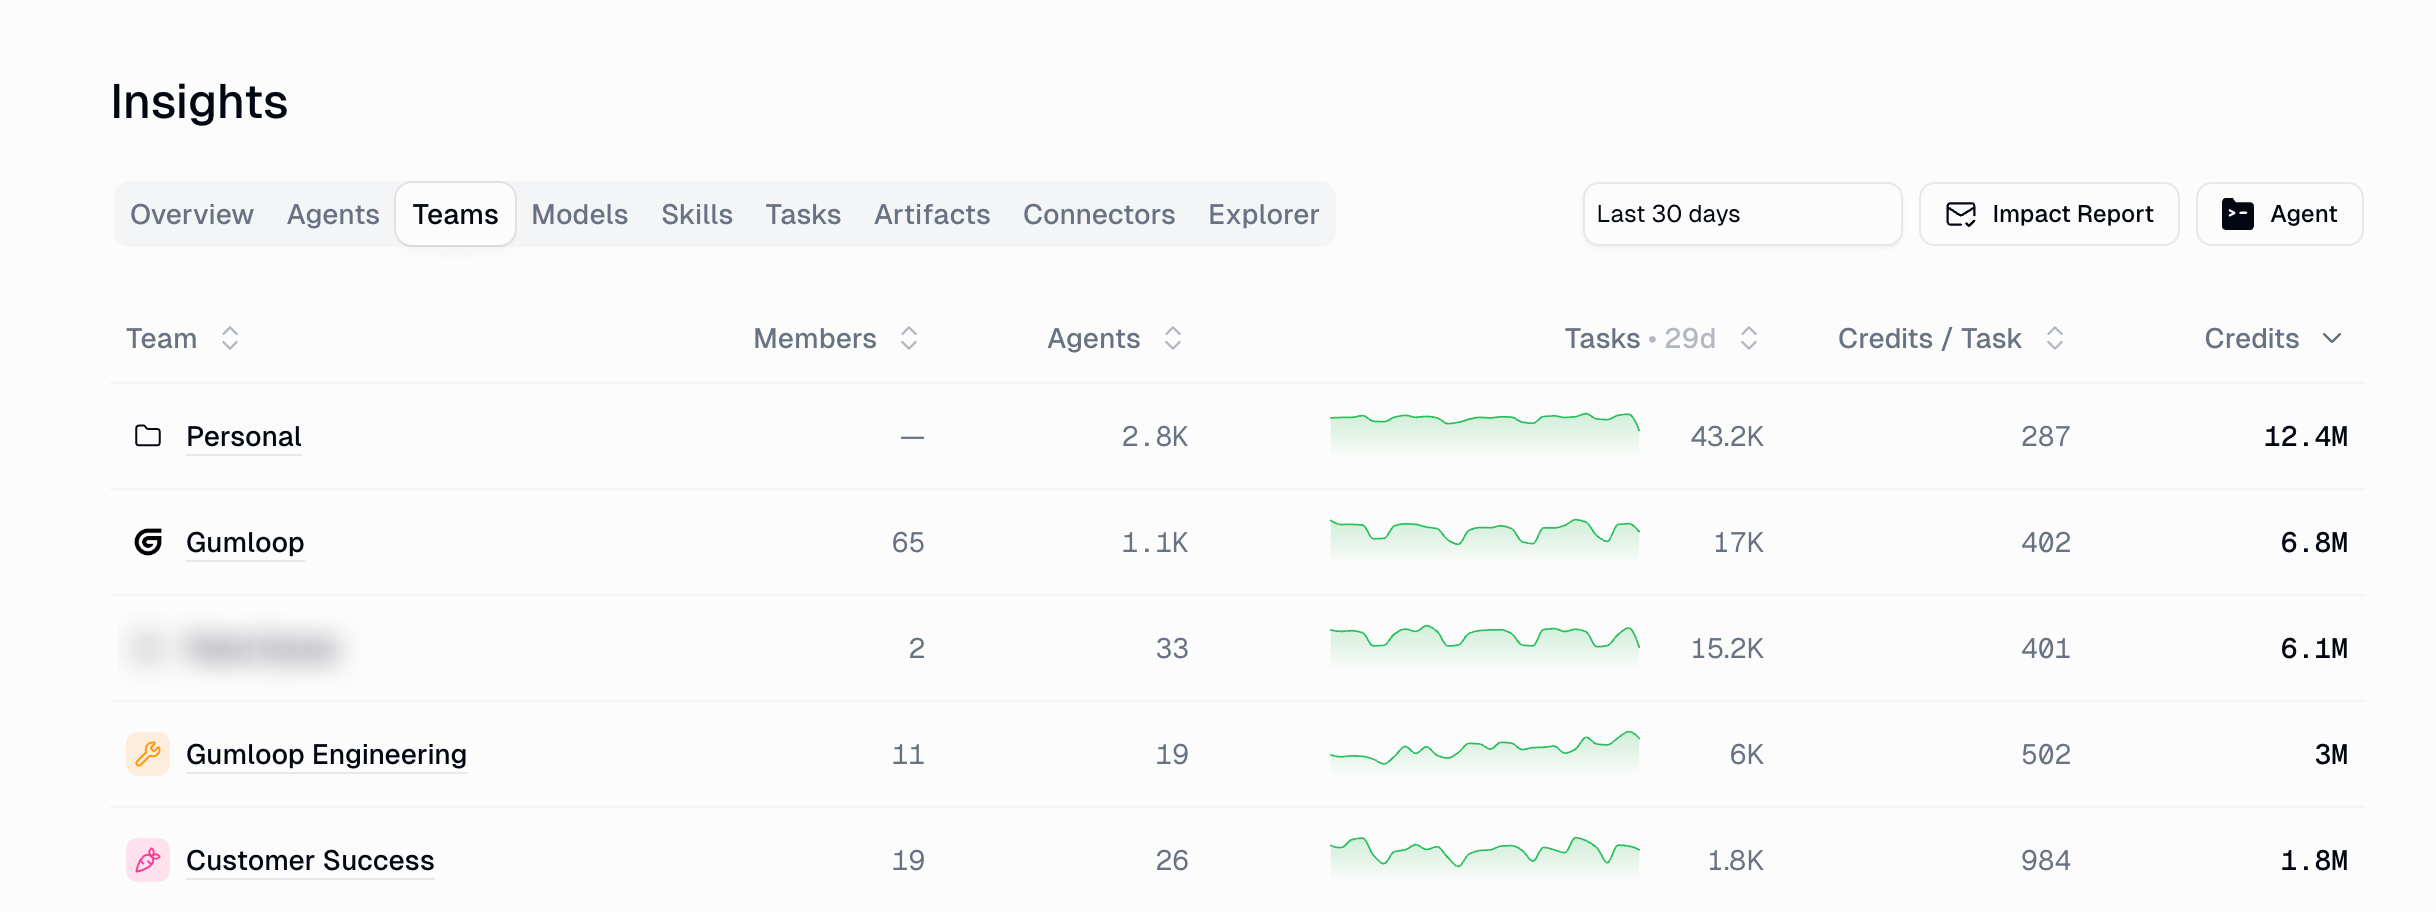 Select a team to drill into its agents, tasks, triggers, models, and members.
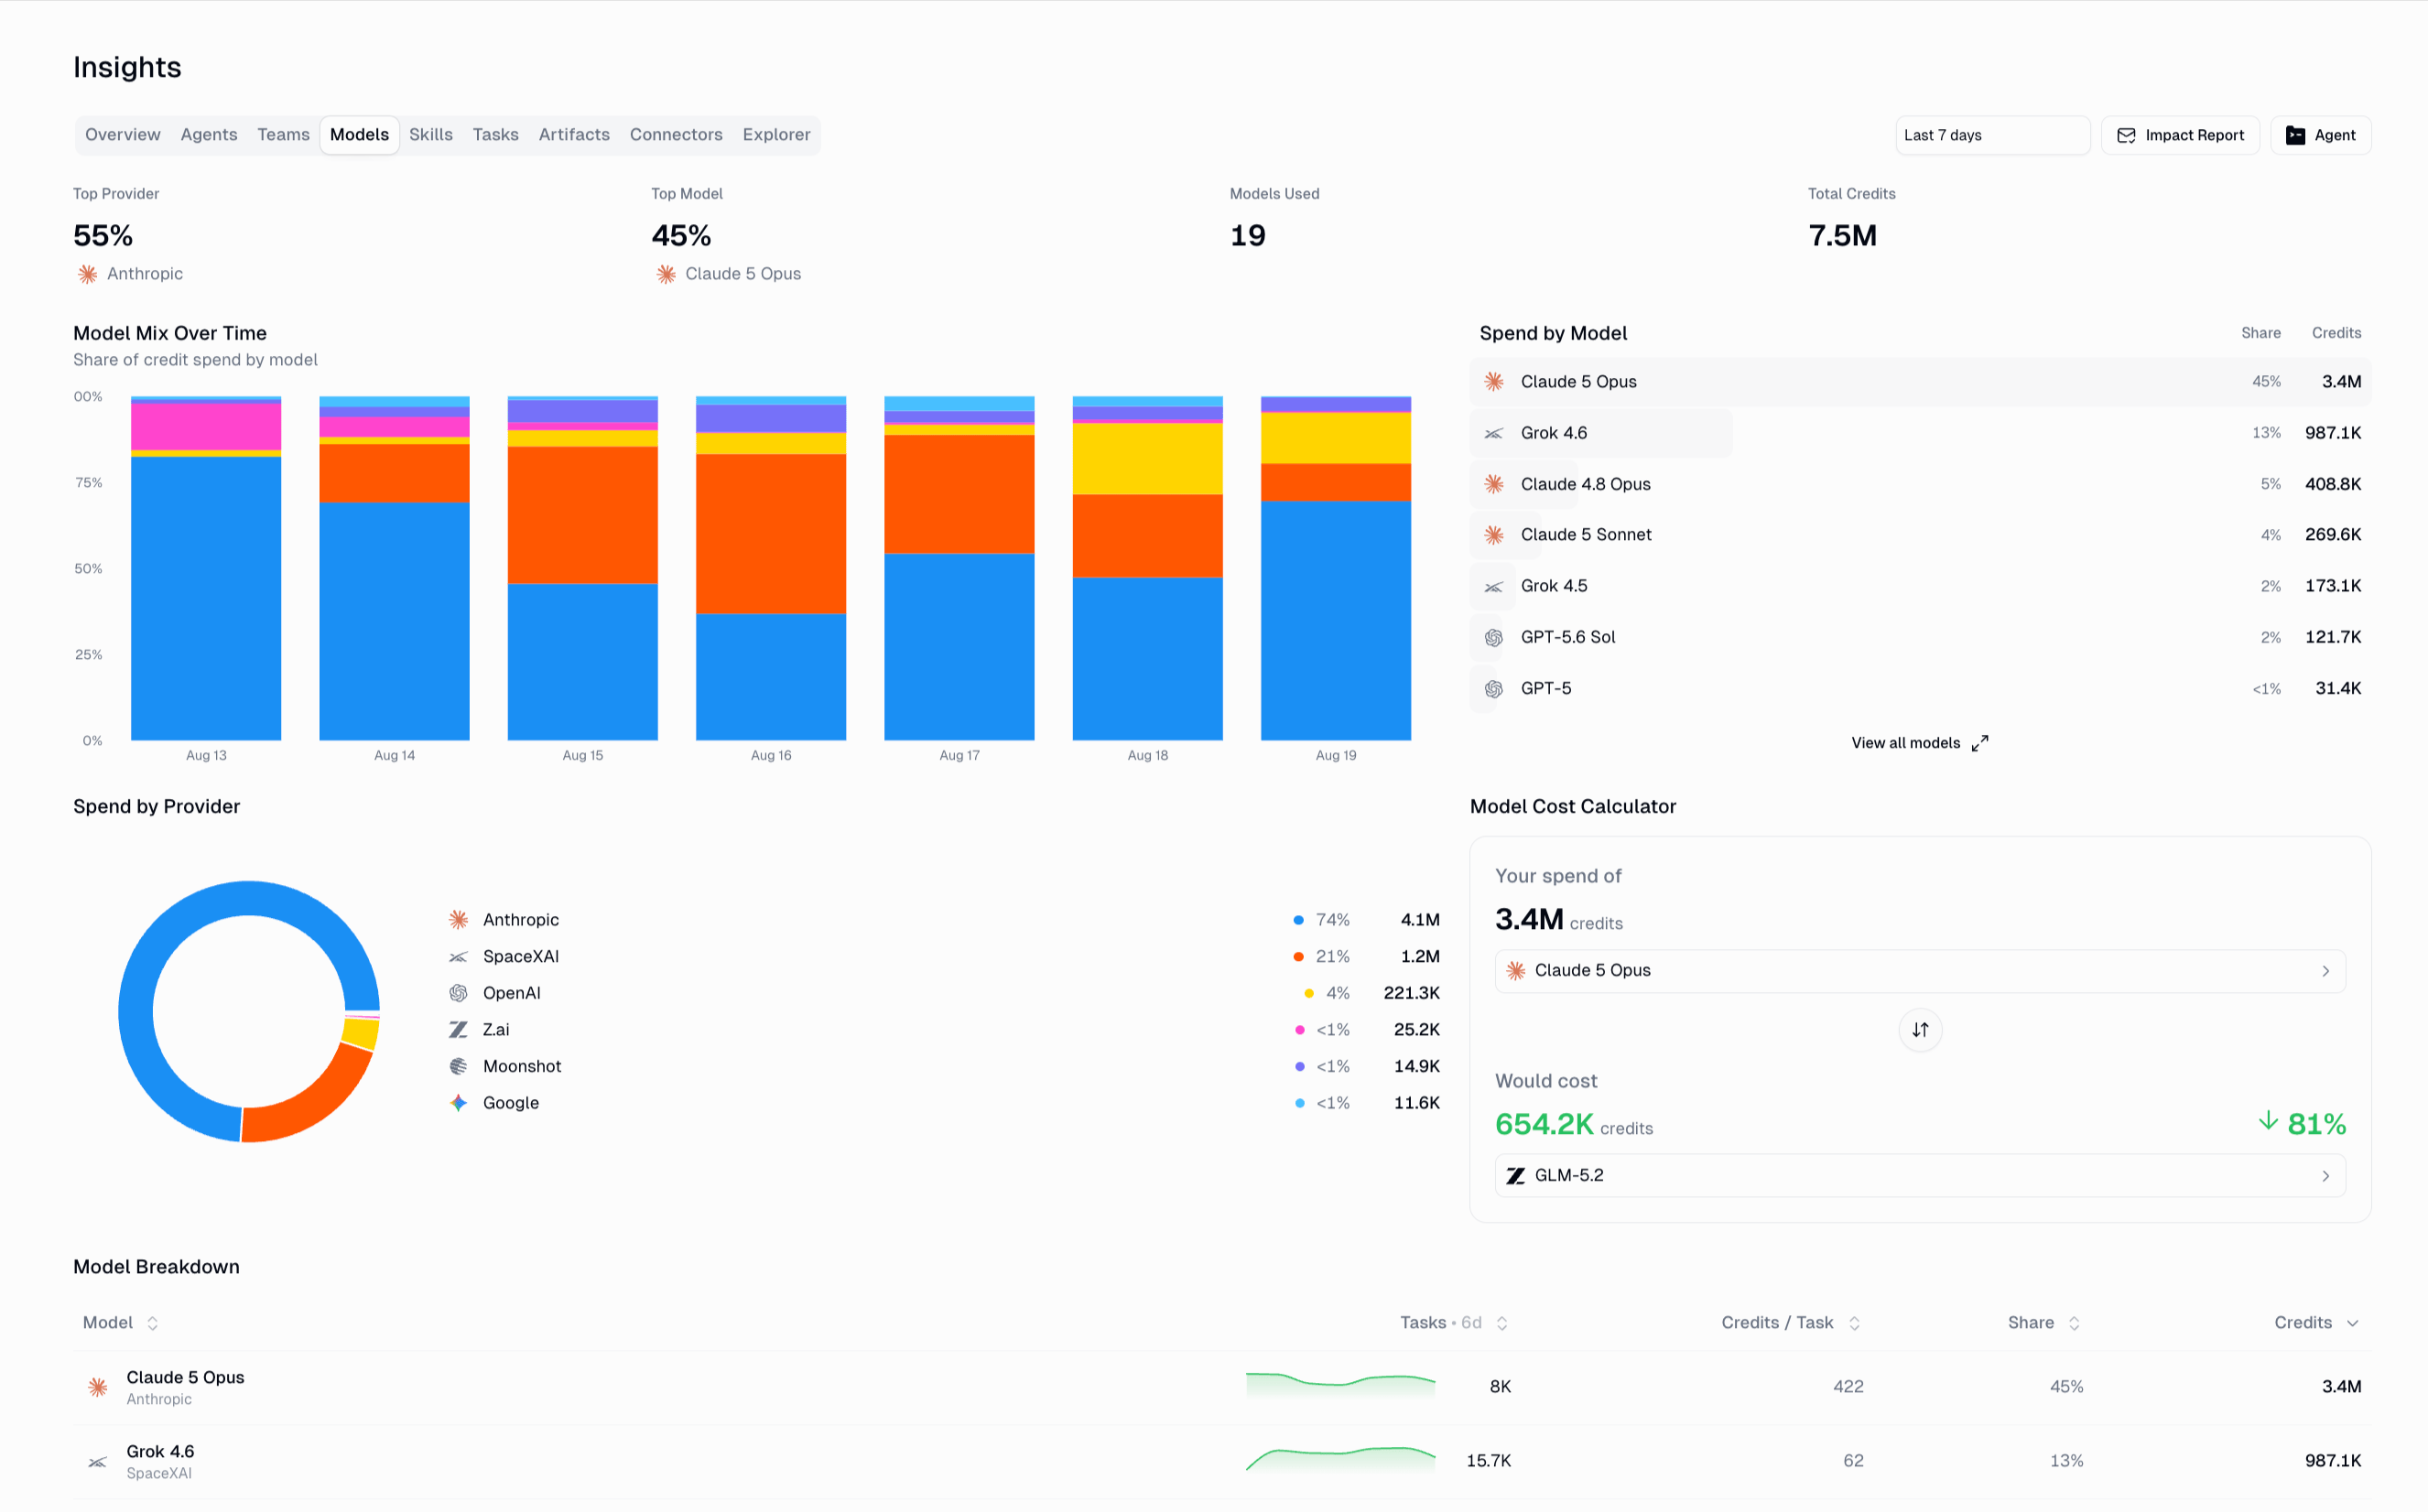
 ### Models
Where model spend actually goes: your top provider and model, the model mix over time, spend by model and by provider, a full model breakdown table, and a **cost calculator** for estimating the effect of switching models.
### Models
Where model spend actually goes: your top provider and model, the model mix over time, spend by model and by provider, a full model breakdown table, and a **cost calculator** for estimating the effect of switching models.
 Pair this with [AI Model Control](/enterprise-features/ai_model_control) when you want to steer the org toward cheaper models.
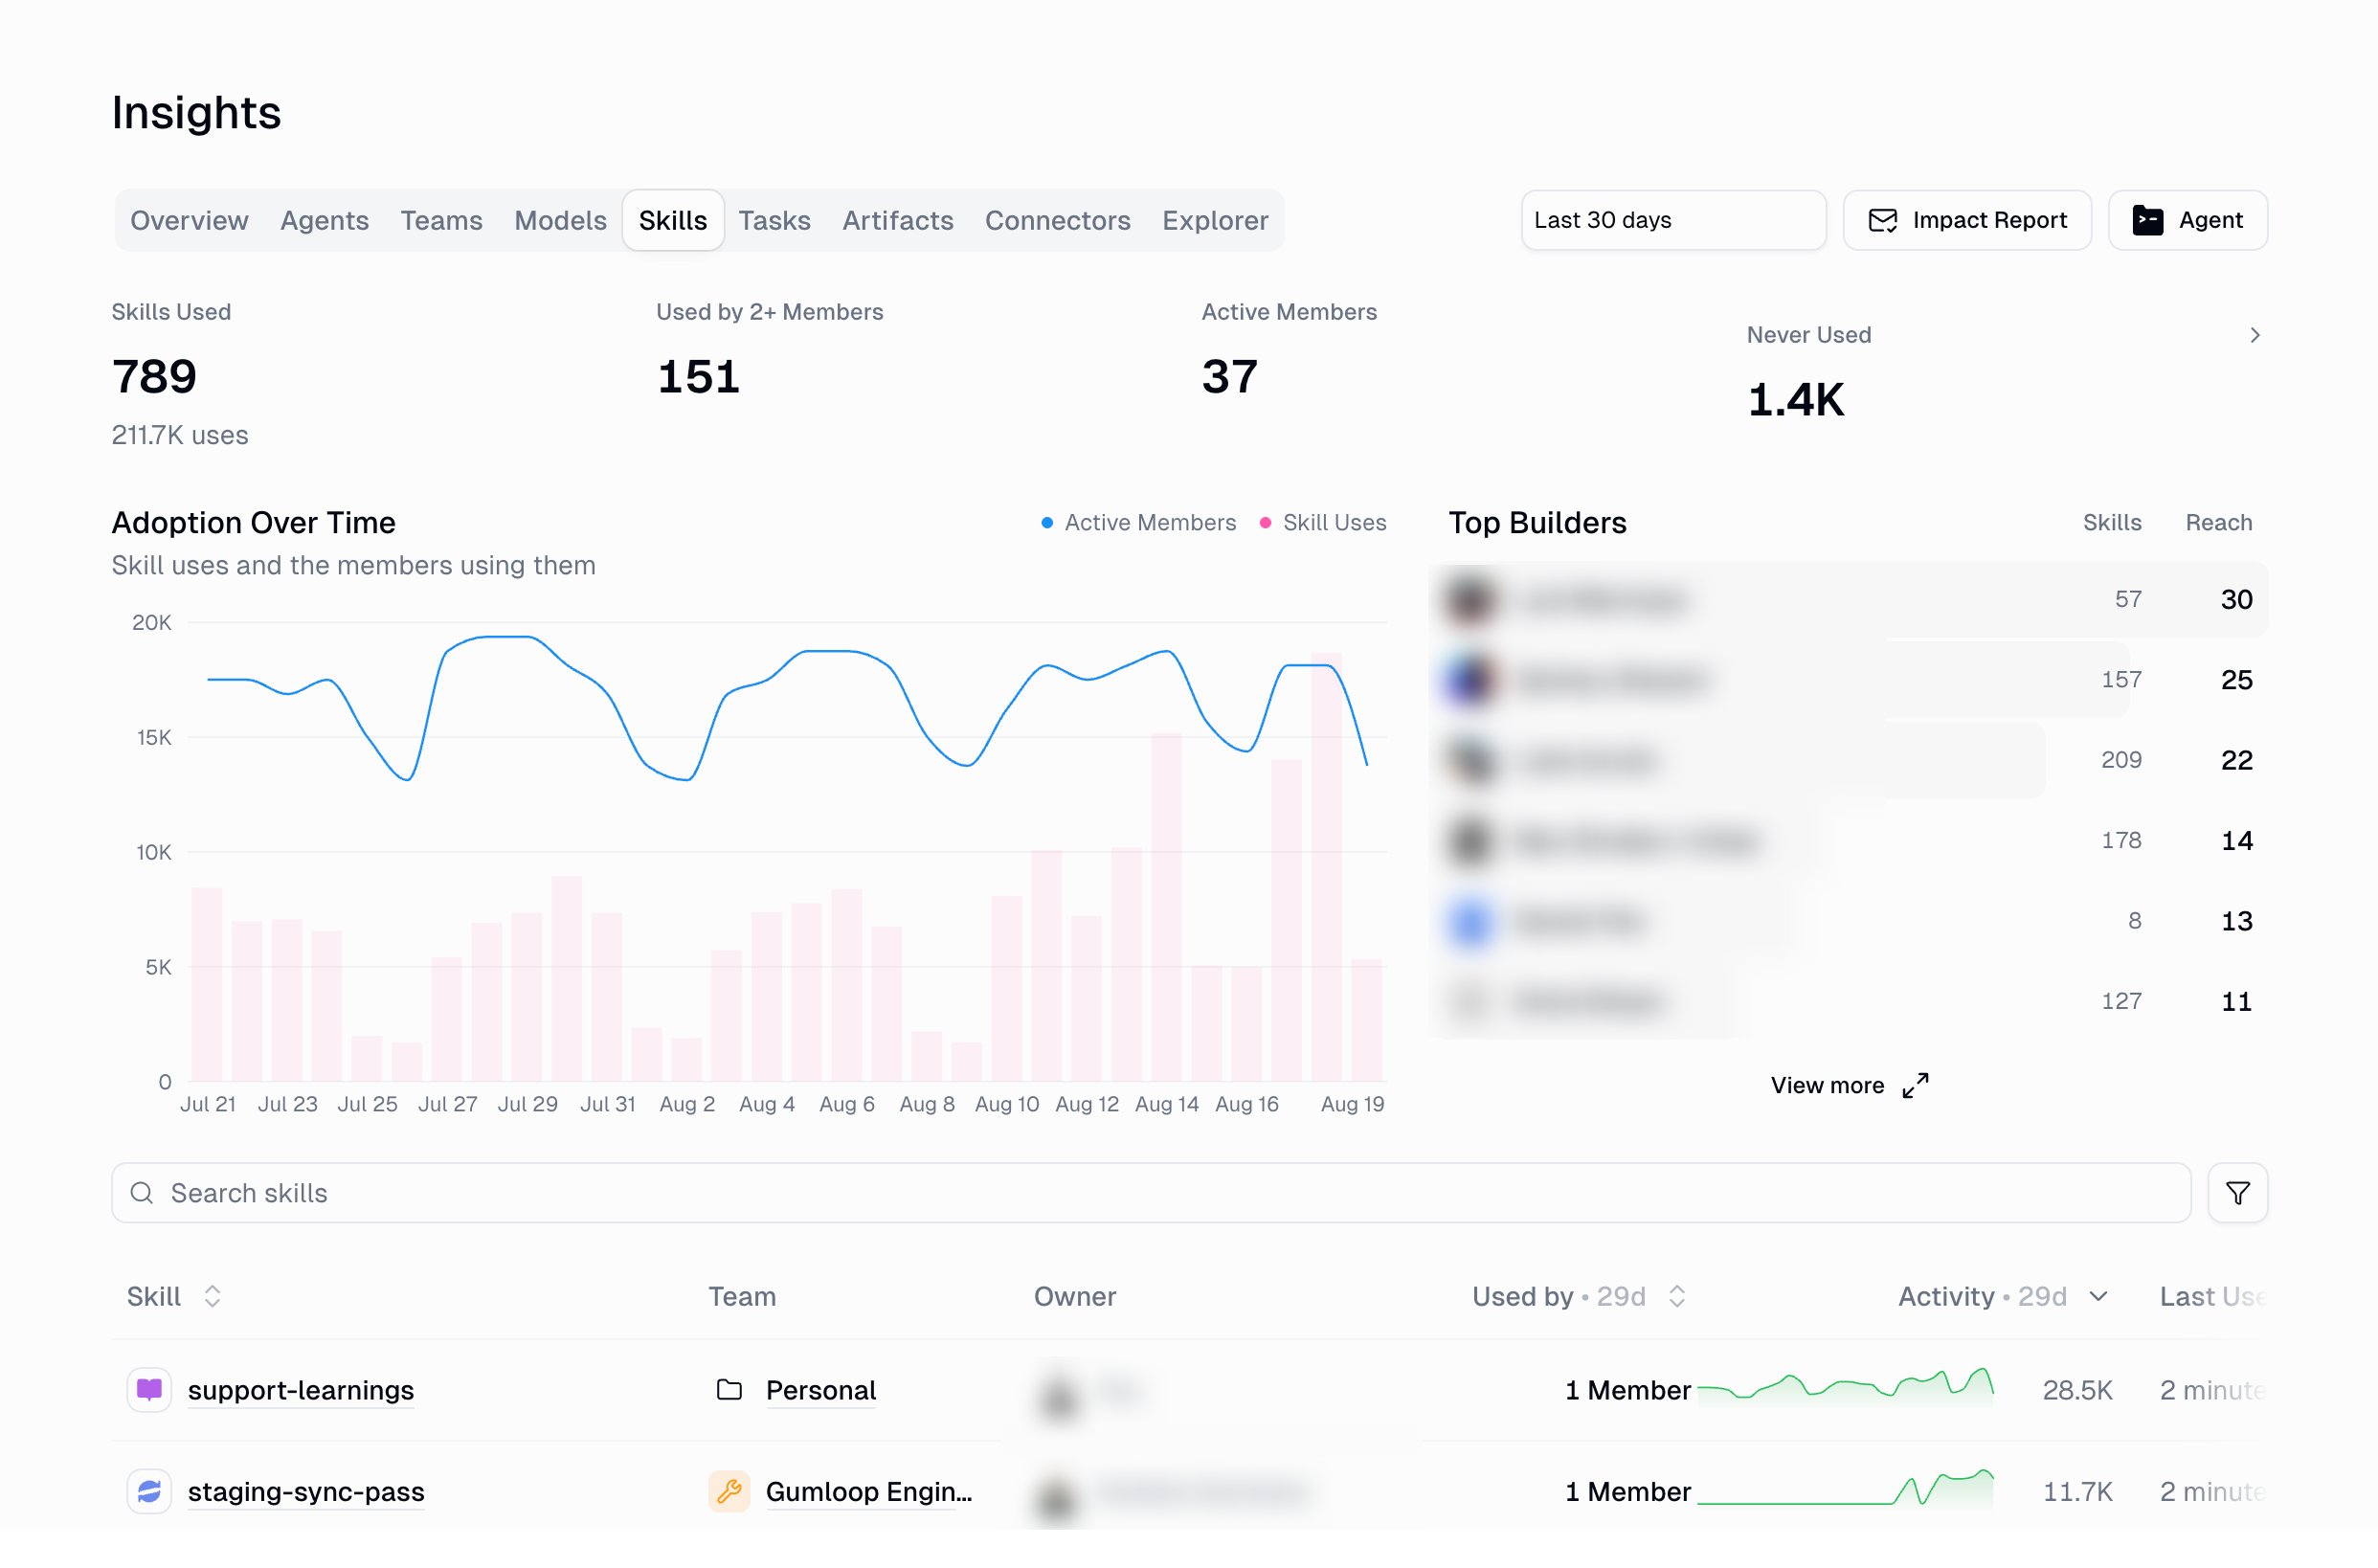
### Skills
[Skill](/core-concepts/skills) adoption across the org: **skills used** (and total uses), **used by 2+ members**, **active members**, and **never used** — plus adoption over time, your **top builders**, and a searchable per-skill table with team, owner, how many members use it, activity, and last used.
Pair this with [AI Model Control](/enterprise-features/ai_model_control) when you want to steer the org toward cheaper models.
### Skills
[Skill](/core-concepts/skills) adoption across the org: **skills used** (and total uses), **used by 2+ members**, **active members**, and **never used** — plus adoption over time, your **top builders**, and a searchable per-skill table with team, owner, how many members use it, activity, and last used.
 ### Tasks
What agents actually worked on. KPI cards for tasks, members, triggered tasks, and failure rate, a **where work happens** trend by channel, and a **source** ranking. Four views:
| View | Shows |
| ------------------ | ----------------------------------------------------------------------------------------------------------------- |
| **Triggers** | Every [trigger](/core-concepts/agent_triggers) with its type, agent, owner, status, tasks, and credits |
| **History** | Individual task runs |
| **Slack channels** | Task volume per Slack channel |
| **Slack apps** | [Slack apps](/core-concepts/custom_slack_app) deployed from your agents, who deployed them, and their task volume |
### Tasks
What agents actually worked on. KPI cards for tasks, members, triggered tasks, and failure rate, a **where work happens** trend by channel, and a **source** ranking. Four views:
| View | Shows |
| ------------------ | ----------------------------------------------------------------------------------------------------------------- |
| **Triggers** | Every [trigger](/core-concepts/agent_triggers) with its type, agent, owner, status, tasks, and credits |
| **History** | Individual task runs |
| **Slack channels** | Task volume per Slack channel |
| **Slack apps** | [Slack apps](/core-concepts/custom_slack_app) deployed from your agents, who deployed them, and their task volume |
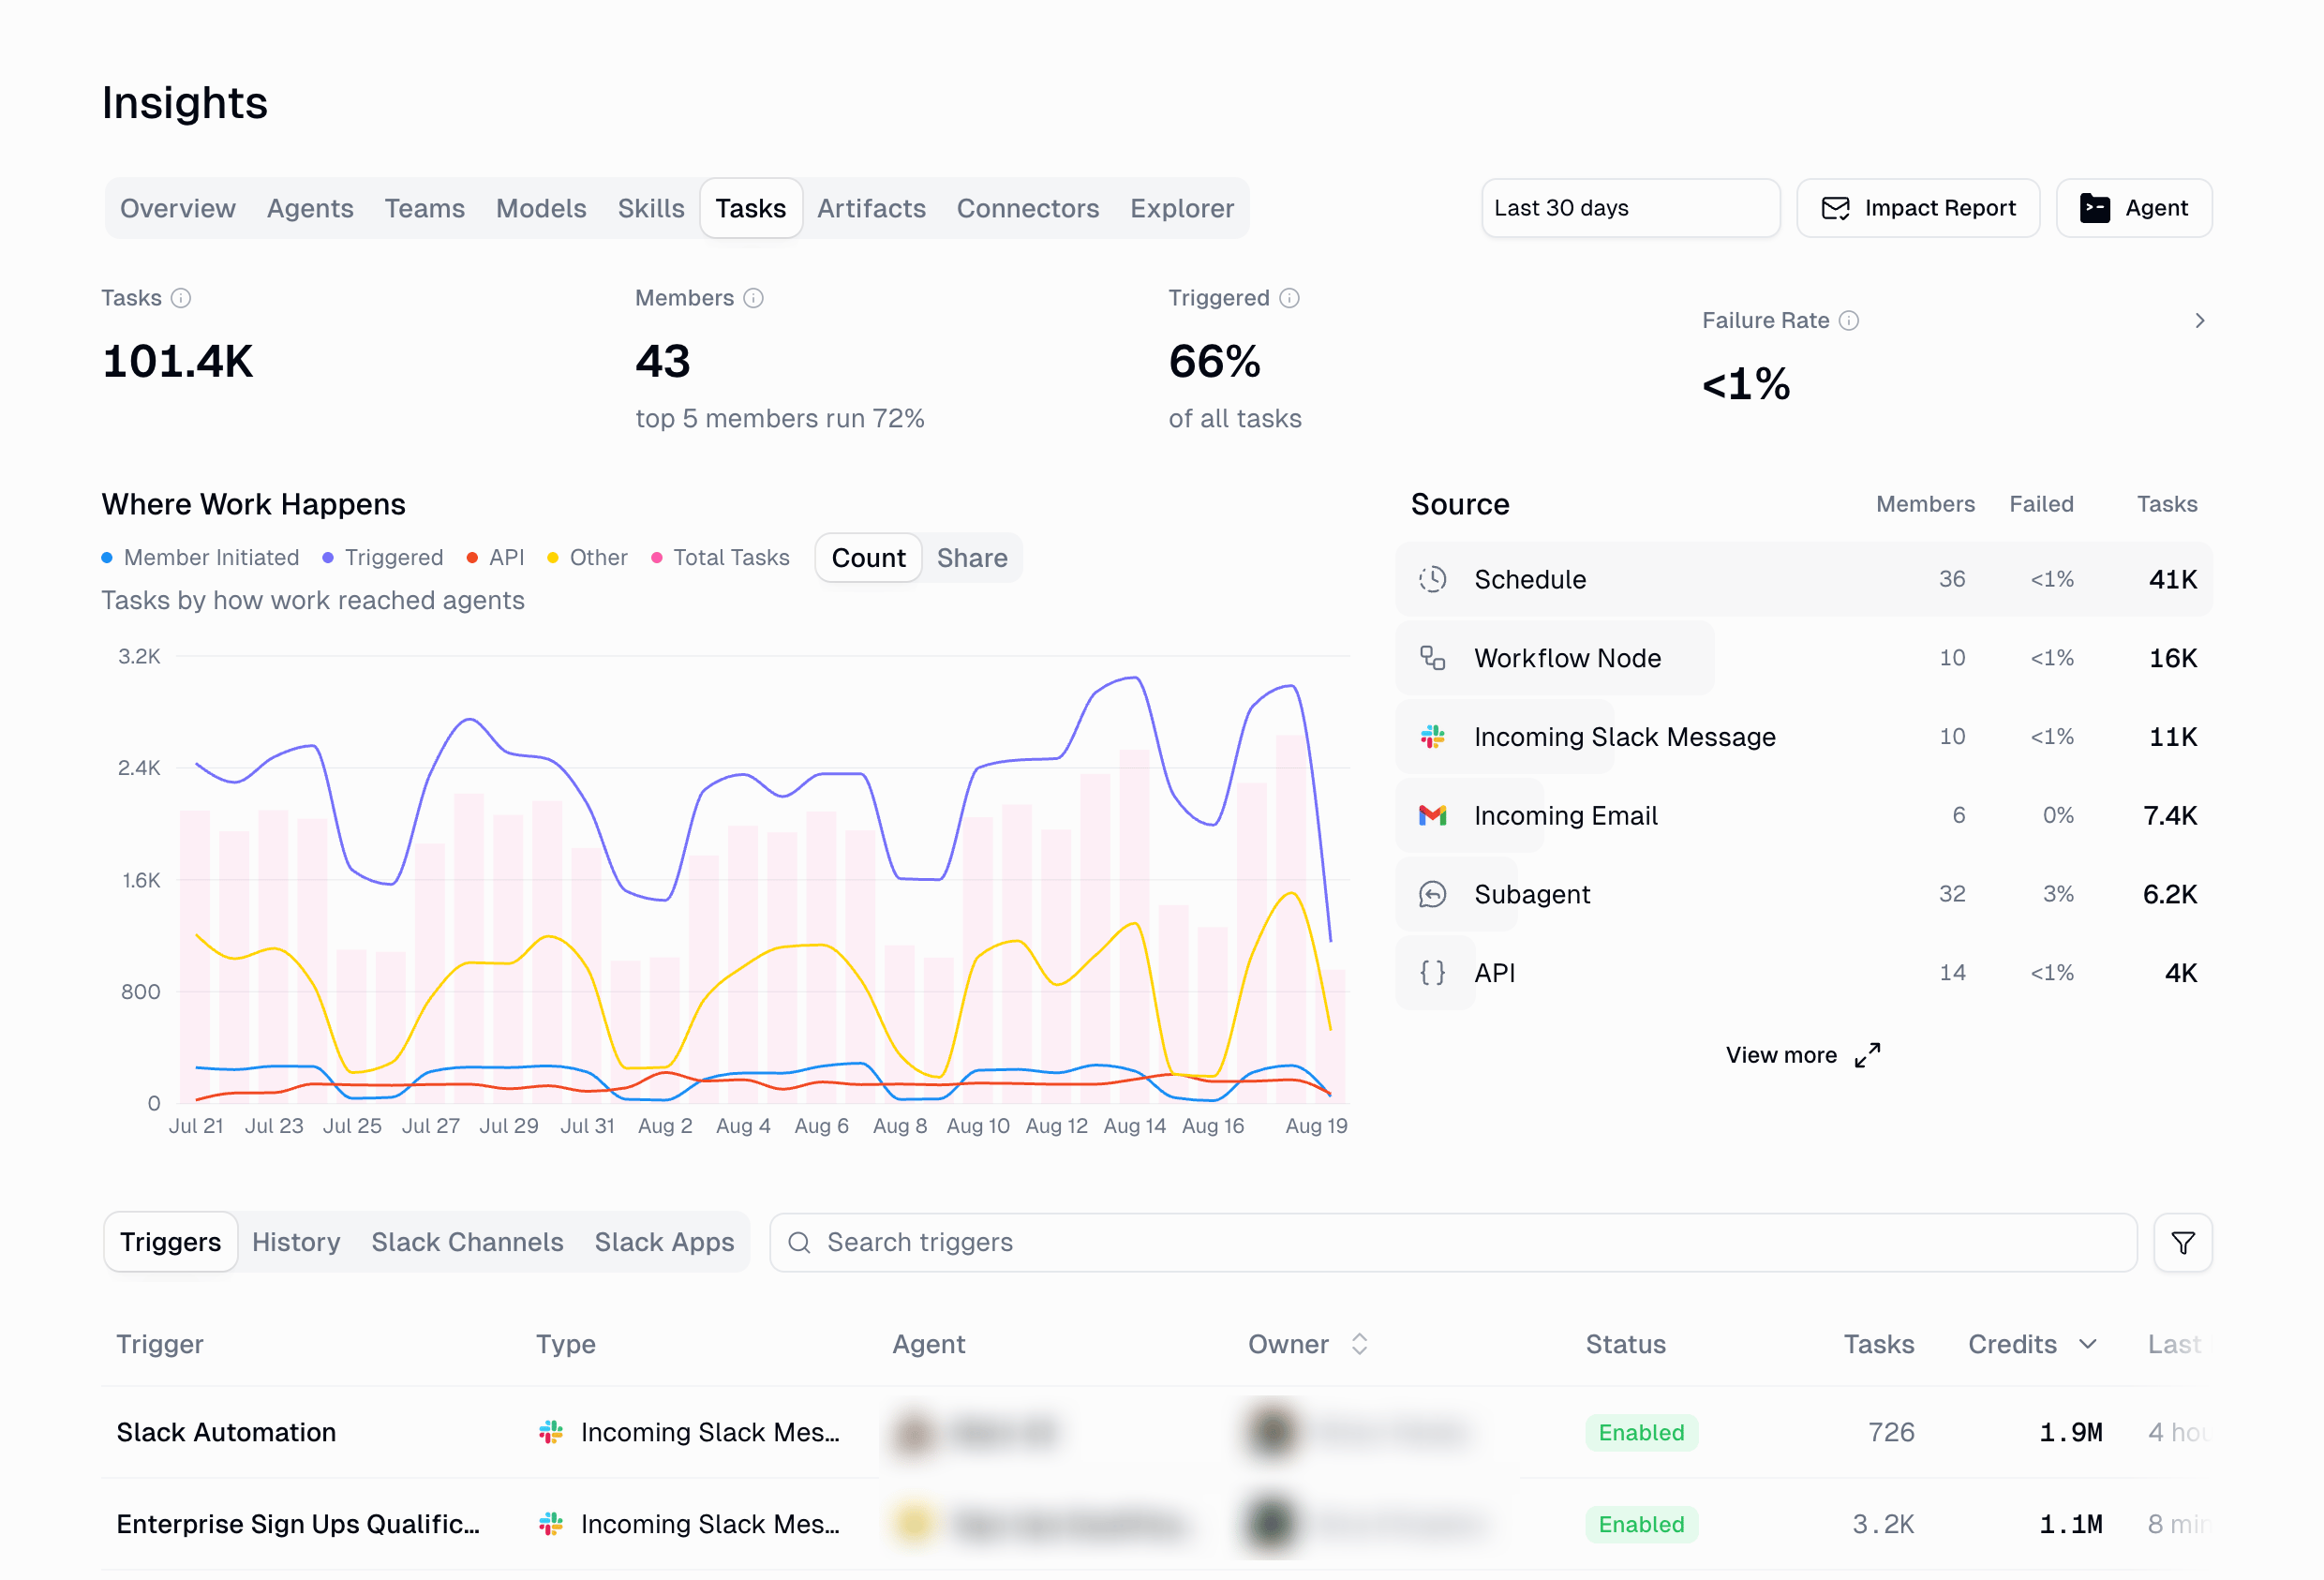 The **Source** ranking shows how work arrives — schedules, workflow nodes, incoming Slack messages, incoming email, subagents, and the API — with failure rate per source.
### Artifacts
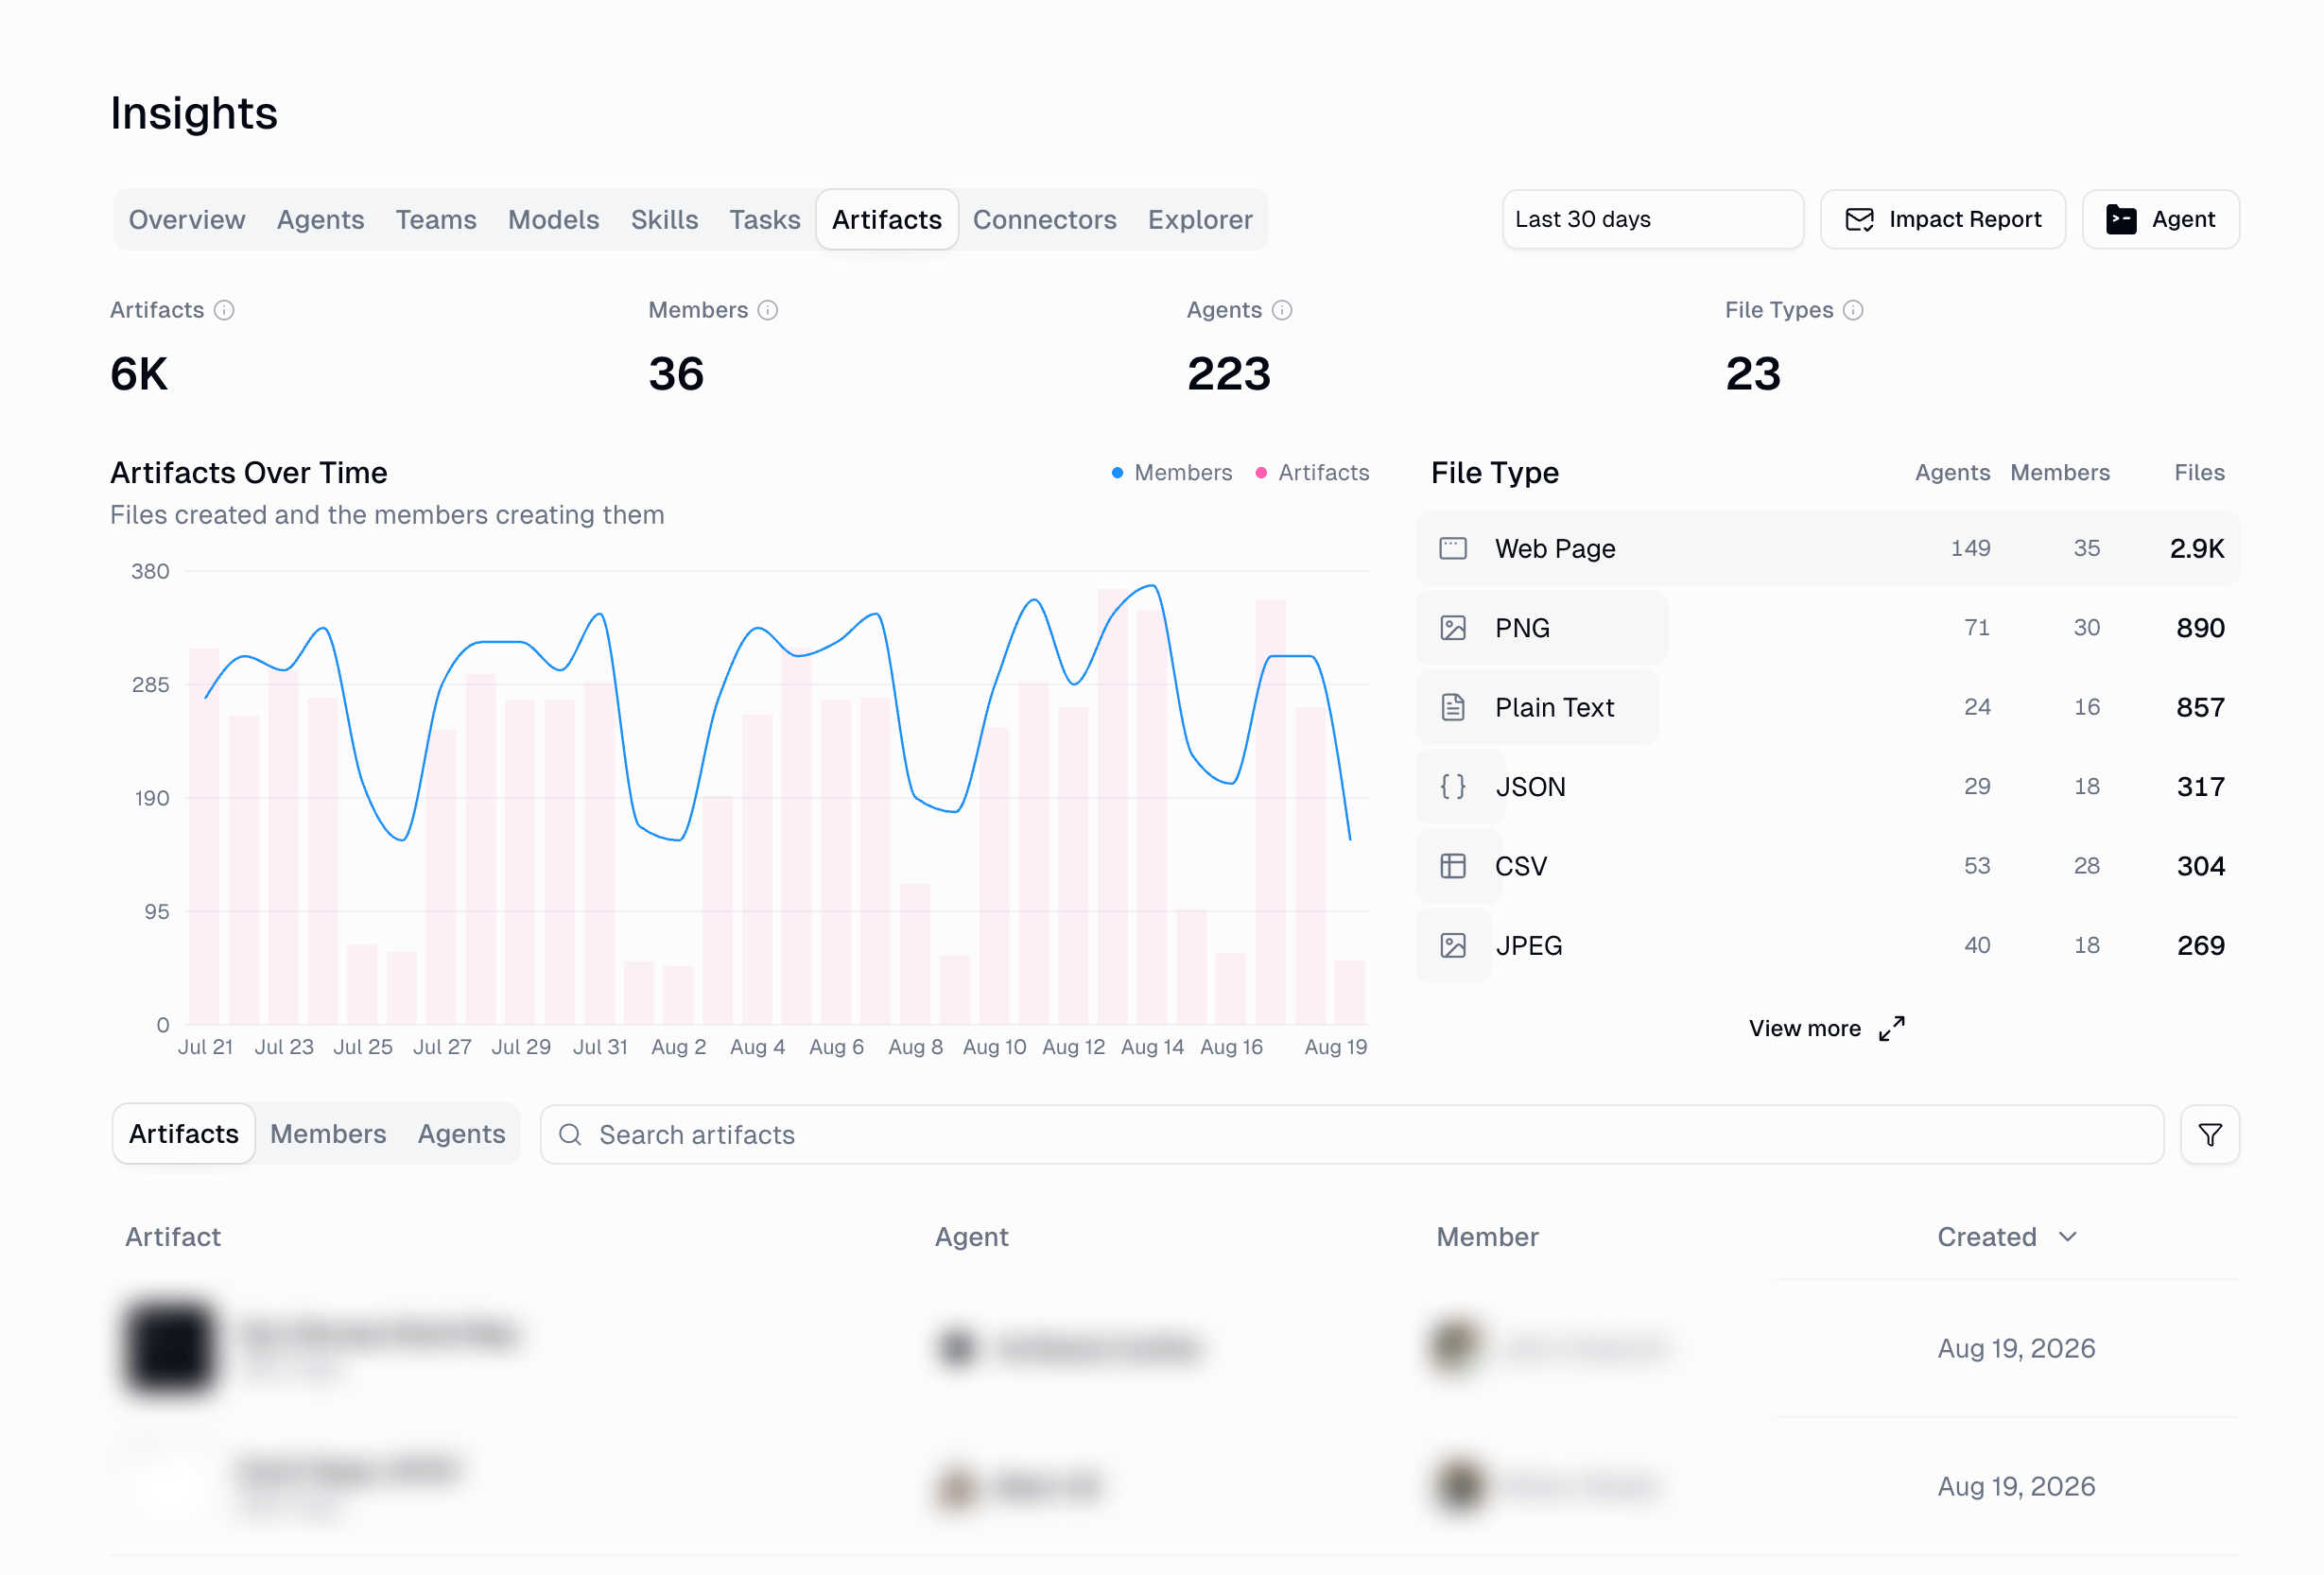
[Artifacts](/core-concepts/agent_artifacts) agents produced: artifact count, creators, agents, and file types, with an artifacts-over-time trend and a file-type ranking (web pages, PNG, plain text, JSON, CSV, and more). Switch between **artifacts**, **members**, and **agents** views.
The **Source** ranking shows how work arrives — schedules, workflow nodes, incoming Slack messages, incoming email, subagents, and the API — with failure rate per source.
### Artifacts
[Artifacts](/core-concepts/agent_artifacts) agents produced: artifact count, creators, agents, and file types, with an artifacts-over-time trend and a file-type ranking (web pages, PNG, plain text, JSON, CSV, and more). Switch between **artifacts**, **members**, and **agents** views.
 ### Connectors
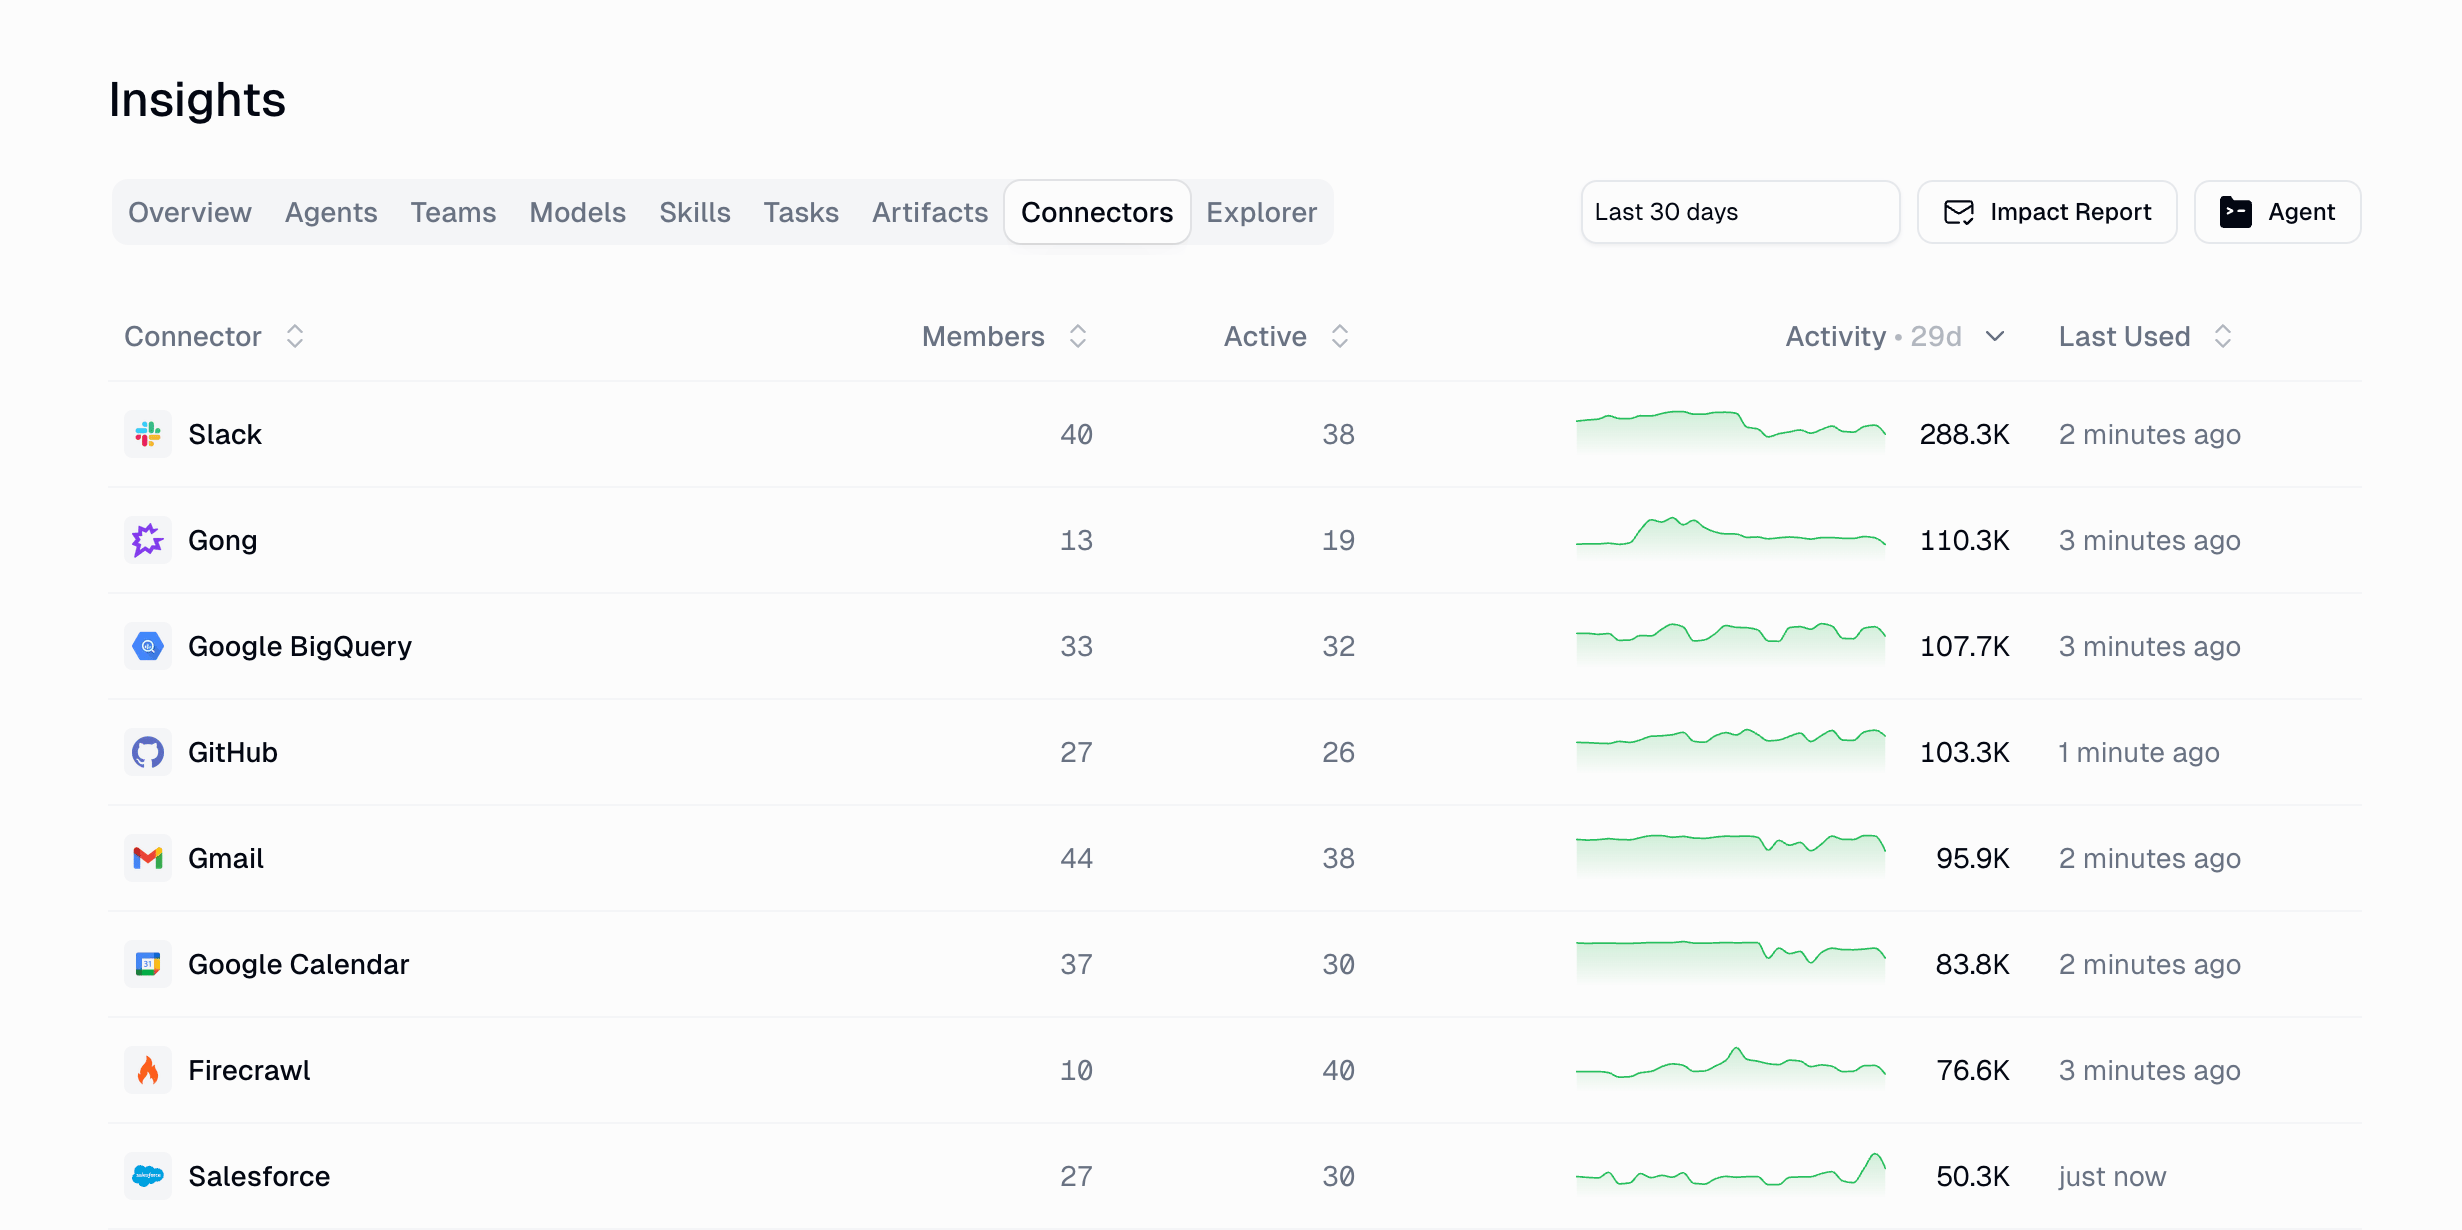
Which [connectors](/core-concepts/credentials) are actually in use — members connected, active members, an activity trend, and last used per connector. Select a connector to see the members who connected it and the agents using it.
### Connectors
Which [connectors](/core-concepts/credentials) are actually in use — members connected, active members, an activity trend, and last used per connector. Select a connector to see the members who connected it and the agents using it.
 ### Explorer
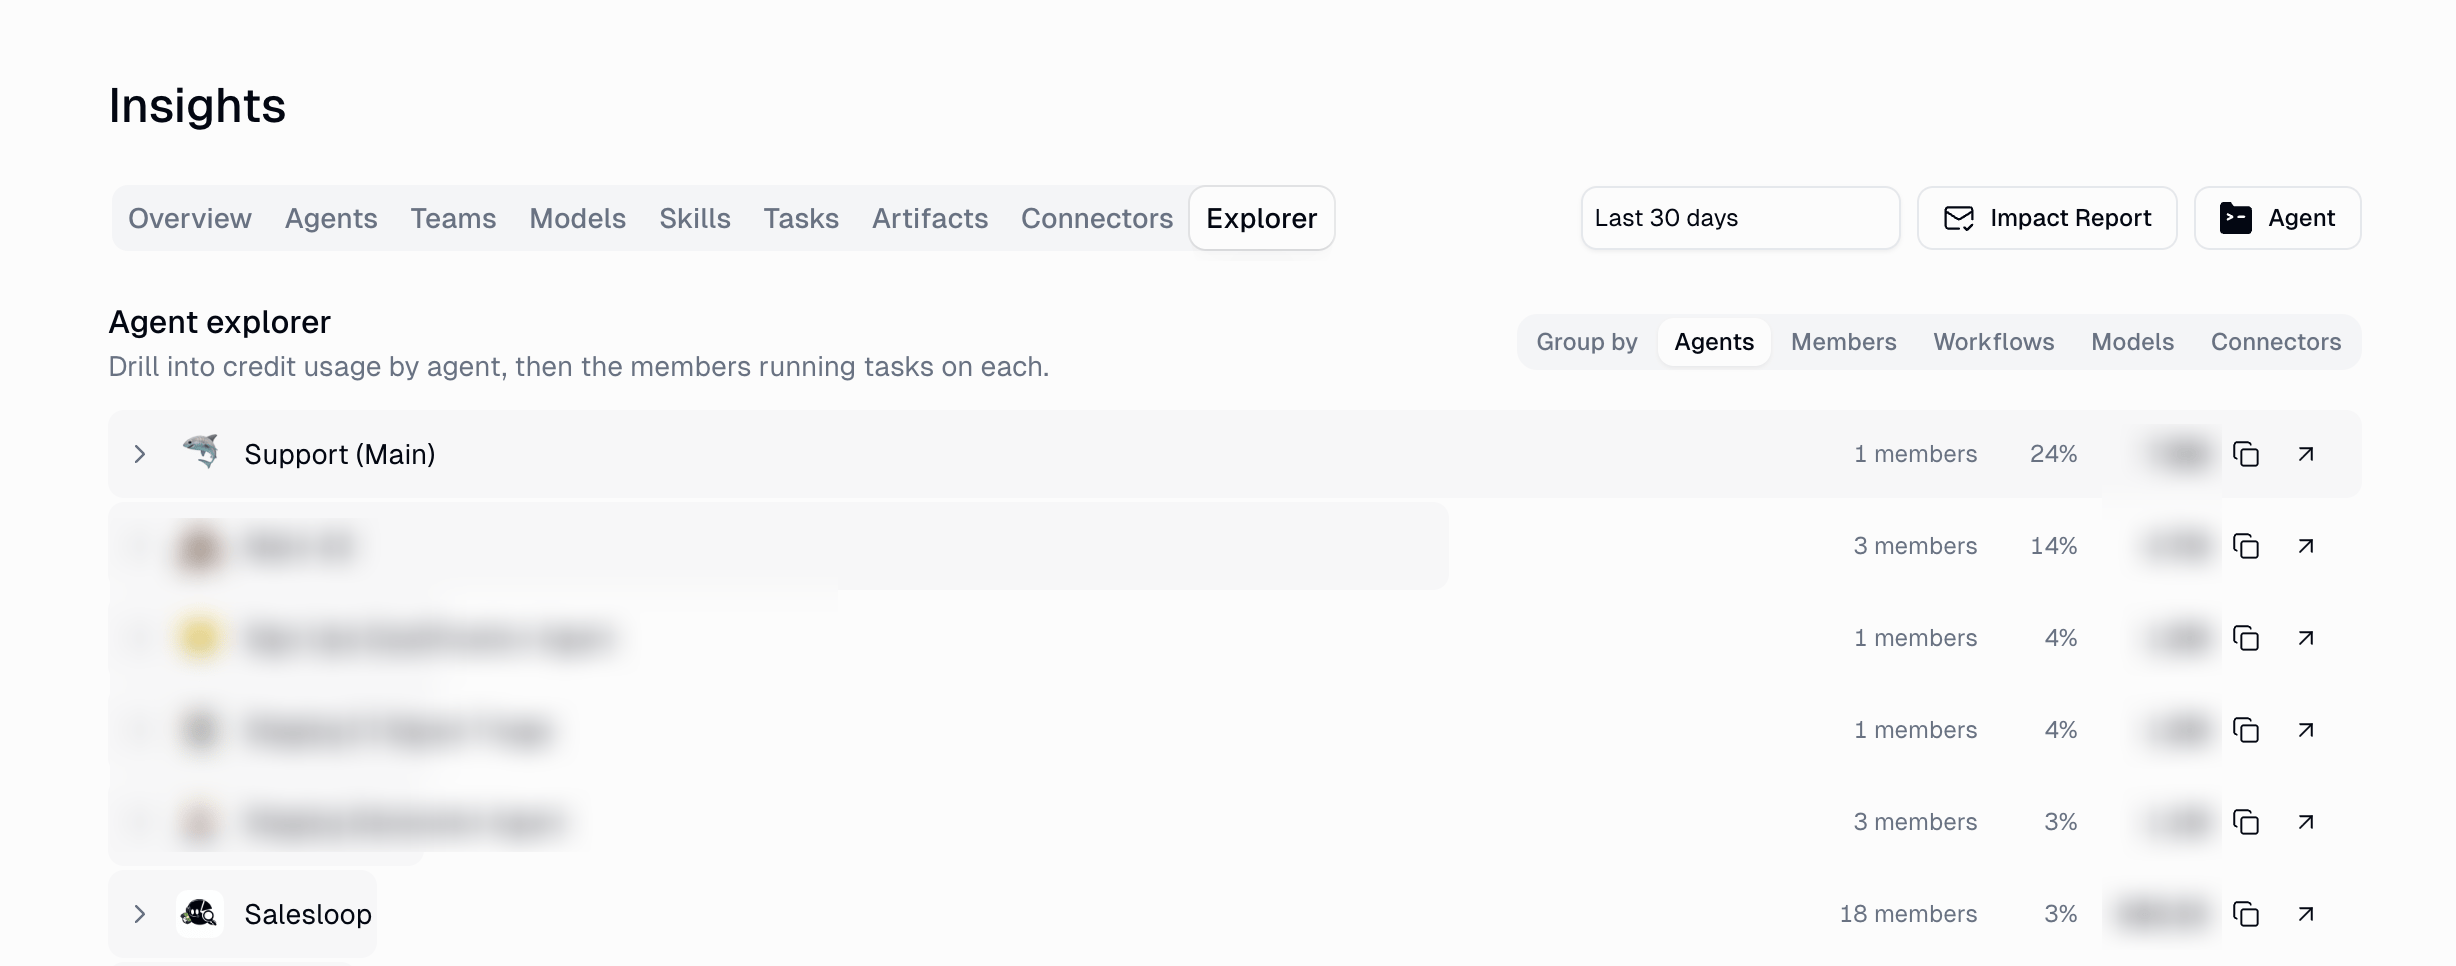
Free-form slicing when no tab answers your question. Choose what to **group by**, then expand a row to drill one level deeper. Each row shows its share of credit spend.
| Group by | Expand a row to see |
| -------------- | --------------------------------------------- |
| **Agents** | The members running tasks on each agent |
| **Members** | The agents each member uses |
| **Workflows** | The members running each workflow |
| **Models** | The agents using each model |
| **Connectors** | The members who have connected each connector |
### Explorer
Free-form slicing when no tab answers your question. Choose what to **group by**, then expand a row to drill one level deeper. Each row shows its share of credit spend.
| Group by | Expand a row to see |
| -------------- | --------------------------------------------- |
| **Agents** | The members running tasks on each agent |
| **Members** | The agents each member uses |
| **Workflows** | The members running each workflow |
| **Models** | The agents using each model |
| **Connectors** | The members who have connected each connector |
 ***
## Ask the analytics agent
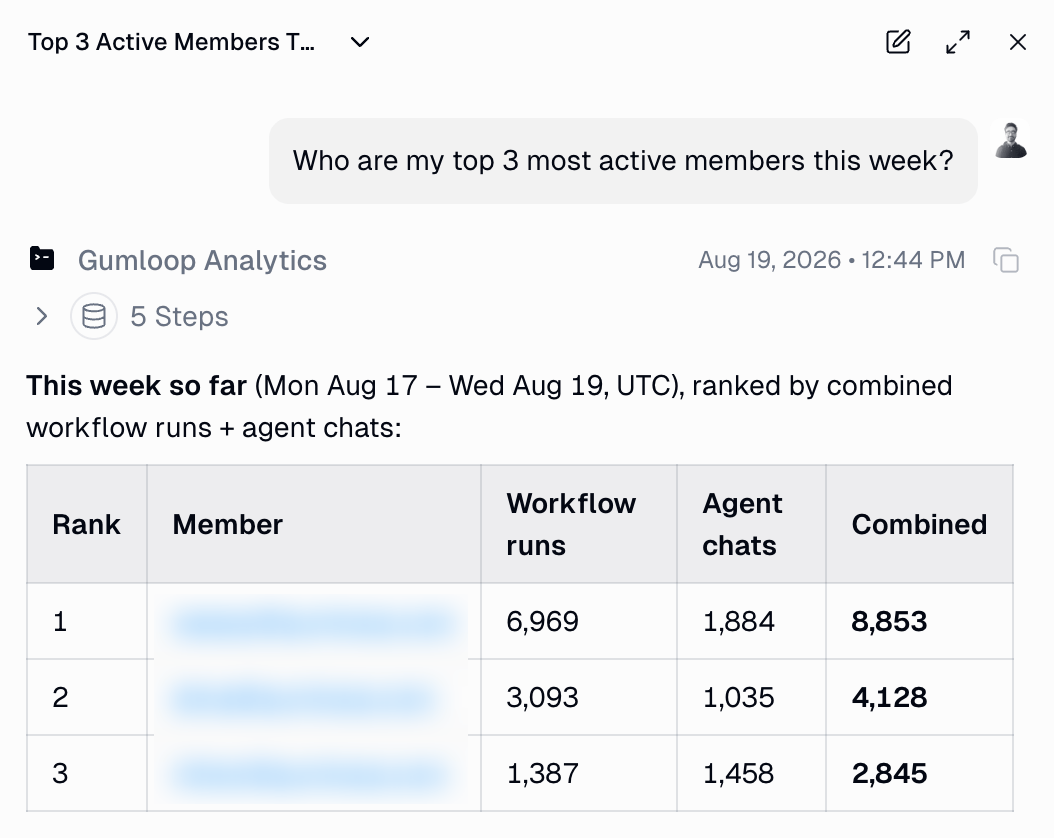
Click **Agent** to open the analytics agent next to your dashboard. Ask a question in natural language, or start from a suggested prompt:
***
## Ask the analytics agent
Click **Agent** to open the analytics agent next to your dashboard. Ask a question in natural language, or start from a suggested prompt:
 * **Who are my top 3 most active members this week?**
* **What are the most used agents this week?**
* **What are the most used MCP servers this week?**
The agent queries your organization's data and answers with tables, charts, or CSV exports. Generated files open in a new tab.
* **Who are my top 3 most active members this week?**
* **What are the most used agents this week?**
* **What are the most used MCP servers this week?**
The agent queries your organization's data and answers with tables, charts, or CSV exports. Generated files open in a new tab.
 **In the rail you can**:
* Expand the rail for a wider chat, or collapse it to get the full dashboard back
* Start a new chat, or reopen a previous one from the chat history popover
* Turn on **incognito** for a chat that is not saved to history (Enterprise plans; an admin can disable it for the organization)
* On mobile, the agent opens as a full-screen chat instead of a rail
Chat history follows your access to Insights. If the analytics role is removed from a member, they also lose access to their past analytics conversations.
### In Slack
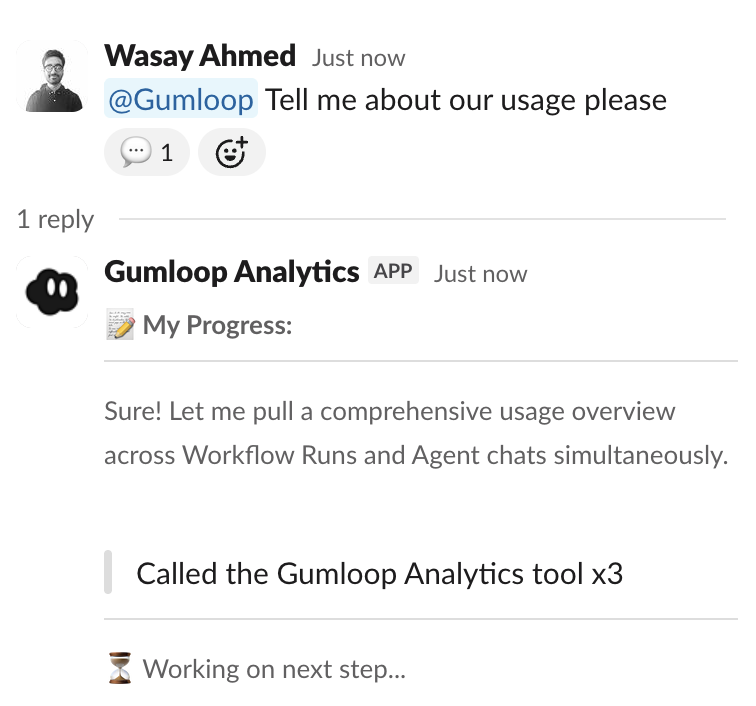
The same agent is available in [Slack](/core-concepts/agents_slack), so you can ask questions where your team already works.
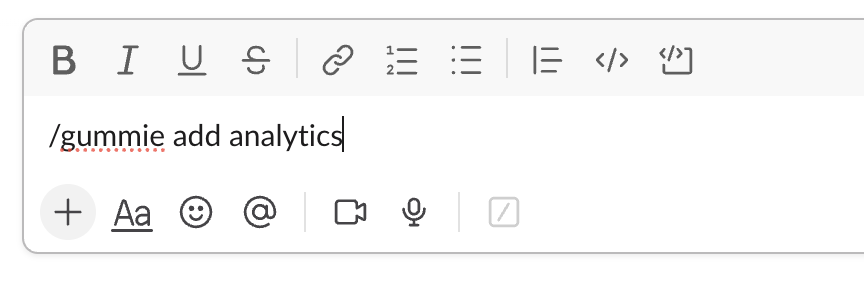
Invite the Gumloop bot to the Slack channel where you want to use analytics.
Type `/gummie add analytics` in the channel to activate the analytics agent.
**In the rail you can**:
* Expand the rail for a wider chat, or collapse it to get the full dashboard back
* Start a new chat, or reopen a previous one from the chat history popover
* Turn on **incognito** for a chat that is not saved to history (Enterprise plans; an admin can disable it for the organization)
* On mobile, the agent opens as a full-screen chat instead of a rail
Chat history follows your access to Insights. If the analytics role is removed from a member, they also lose access to their past analytics conversations.
### In Slack
The same agent is available in [Slack](/core-concepts/agents_slack), so you can ask questions where your team already works.
Invite the Gumloop bot to the Slack channel where you want to use analytics.
Type `/gummie add analytics` in the channel to activate the analytics agent.
 Mention **@Gumloop** and ask your question. The agent replies in the thread.
 ### What you can ask about
| Data | What it covers |
| ----------------------- | ------------------------------------------------------------------------------------------------------------ |
| **Workflow runs** | Run history, credit costs, execution counts, completion timestamps |
| **Agent chats** | Chat sessions with agents, credit costs per chat, chat volume over time |
| **Agents** | Agent names, descriptions, models used, tools configured, creator info |
| **Workflows** | Workflow names, descriptions, creator info |
| **Members** | Member emails and activity across your organization |
| **MCP servers** | MCP server usage across your organization |
| **Triggers** | Trigger configurations, types (scheduled, email, Slack, webhooks, polling), status |
| **Skills** | Skill names, descriptions, usage counts, which agents have them attached |
| **Skill usage** | Per-event skill usage log with timestamps, actions (view, use, edit), and which agent or member triggered it |
| **Files** | Files produced by agents, filenames, scopes, creation timestamps |
| **Evaluations** | Chat quality evaluations: grade, sentiment, goal completion, and per-agent breakdowns |
| **Evaluation settings** | Which agents have evaluations enabled, plus model, frequency, and language |
| **Knowledge sources** | Connected Company Brain sources: type, status, and scope (personal, team, organization) |
| **Credits** | Authoritative credit-spend ledger by category, member, team, and model charged |
### Example questions
```text theme={"dark"}
How many credits has our organization used in the last 30 days?
Break it down by member.
```
```text theme={"dark"}
Show me daily credit consumption for the past 3 months as a chart.
```
```text theme={"dark"}
Break down credit spend by category for the last 30 days.
```
```text theme={"dark"}
Which members have been most active in the last 7 days?
Show their workflow runs and agent chats separately.
```
```text theme={"dark"}
What are our top 10 most-run workflows this month? Show credit cost for each.
```
```text theme={"dark"}
How many agent chats happened last week? Which agents are most popular?
```
```text theme={"dark"}
What are the most used MCP servers this week?
```
```text theme={"dark"}
How many active triggers do we have? Break them down by type.
```
```text theme={"dark"}
Which triggers fire most frequently this month?
```
```text theme={"dark"}
Show me all Slack-based triggers and which agents they belong to.
```
```text theme={"dark"}
What are our most-used skills in the last 30 days?
```
```text theme={"dark"}
Which agents have the most skills attached?
```
```text theme={"dark"}
Show me skill usage trends over the past month, grouped by action type.
```
```text theme={"dark"}
How many files were created by agents this week?
```
```text theme={"dark"}
Which agents produce the most files? Show the top 5.
```
```text theme={"dark"}
Show me file creation volume per day for the last 30 days.
```
```text theme={"dark"}
How many agent chats were graded needs review or needs attention in the last 30 days?
```
```text theme={"dark"}
Which agents have the lowest evaluation success rate this month?
```
```text theme={"dark"}
How many agents have evaluations enabled? Break it down by model.
```
```text theme={"dark"}
How many knowledge sources are connected across the organization?
```
```text theme={"dark"}
Break down our knowledge sources by type and status.
```
```text theme={"dark"}
Which knowledge sources are currently in an error state?
```
***
## Impact Reports
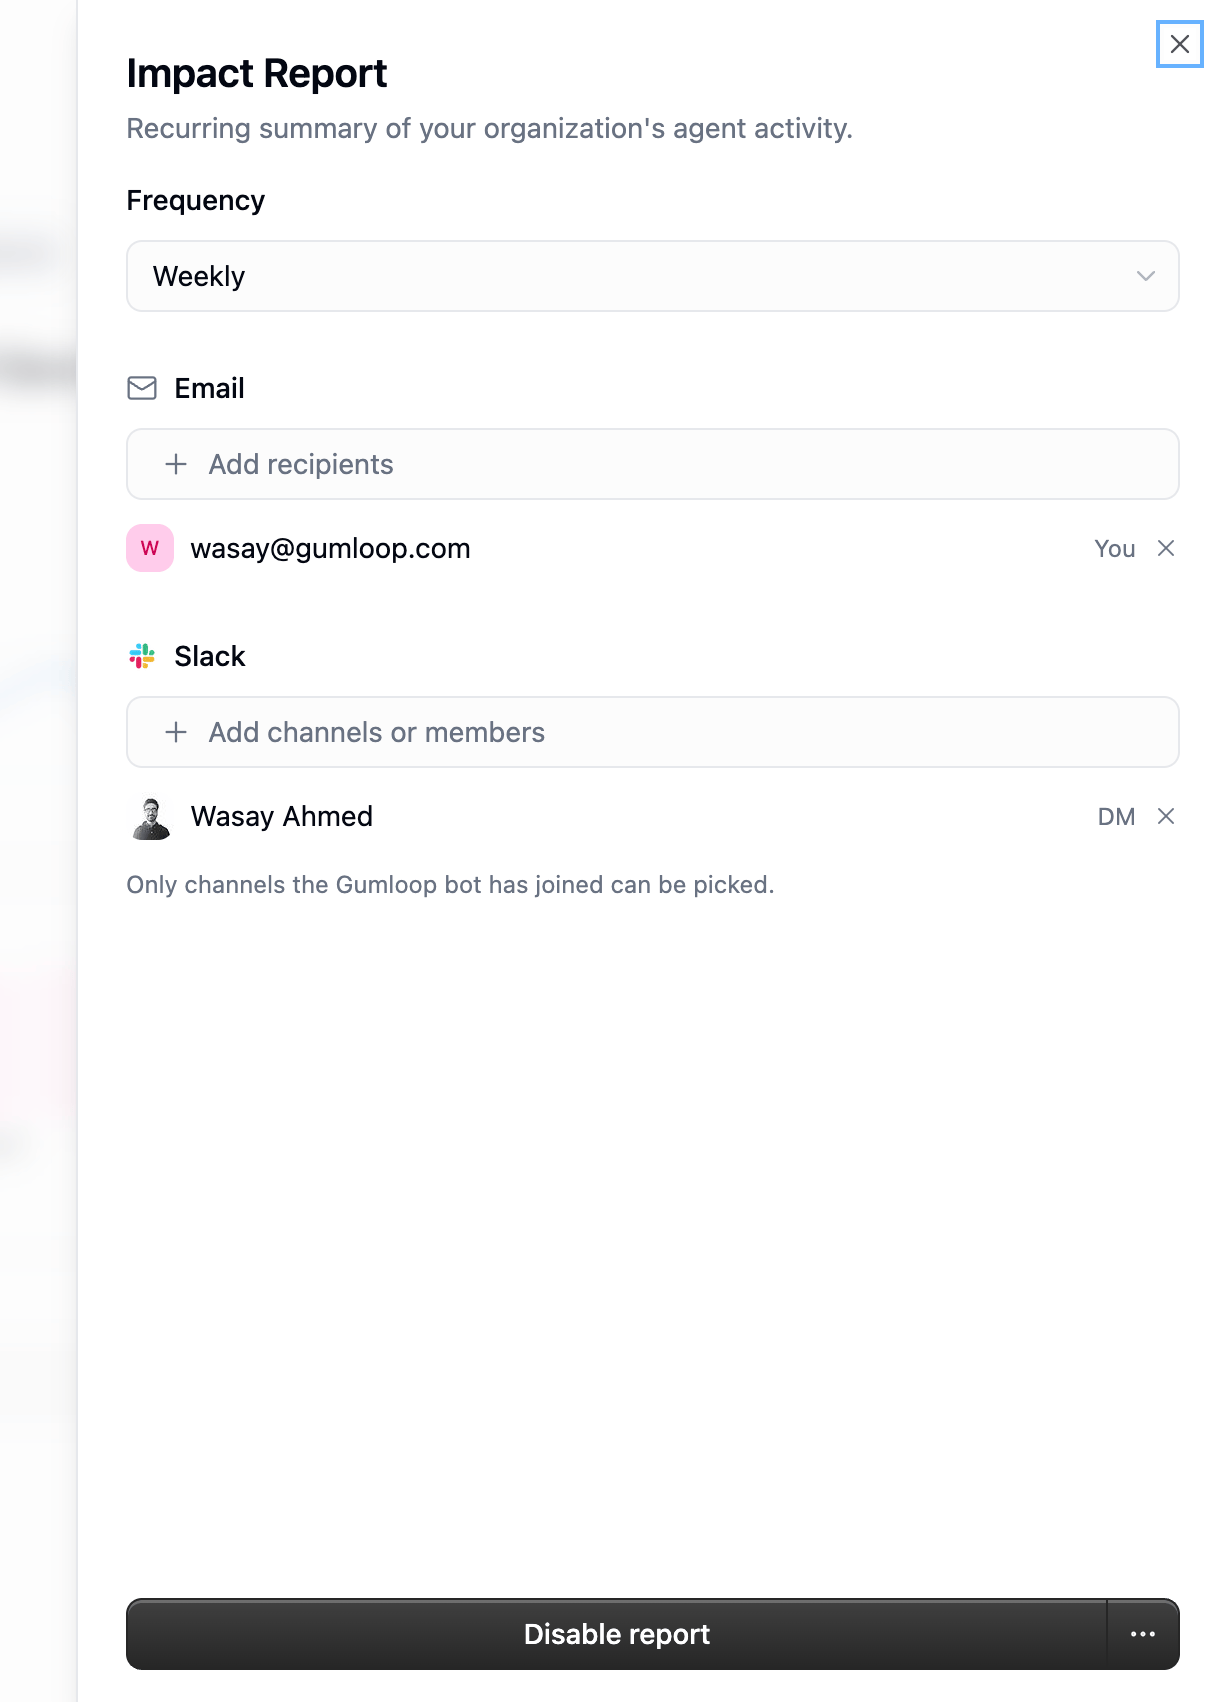
Rather than checking the dashboard, have it delivered. Click **Impact Report** in the Insights toolbar to schedule a recurring summary of your organization's agent activity.
| Setting | Options |
| ------------------ | --------------------------------------------------------- |
| **Cadence** | Weekly or monthly |
| **Email** | Any number of recipient addresses |
| **Slack** | Channels, plus direct messages to specific members |
| **Send me a test** | Sends the report to you immediately so you can preview it |
Only Slack channels the Gumloop bot has joined can be selected. Use **Disable report** in the same panel to stop delivery.
Reports cover the most recently completed period (weeks and months close in UTC) and go out after it closes — emails arrive at 10:00 in each recipient's local time where that is known. Each report's numbers are snapshotted when it is generated, so a retry delivers the same figures.
### What you can ask about
| Data | What it covers |
| ----------------------- | ------------------------------------------------------------------------------------------------------------ |
| **Workflow runs** | Run history, credit costs, execution counts, completion timestamps |
| **Agent chats** | Chat sessions with agents, credit costs per chat, chat volume over time |
| **Agents** | Agent names, descriptions, models used, tools configured, creator info |
| **Workflows** | Workflow names, descriptions, creator info |
| **Members** | Member emails and activity across your organization |
| **MCP servers** | MCP server usage across your organization |
| **Triggers** | Trigger configurations, types (scheduled, email, Slack, webhooks, polling), status |
| **Skills** | Skill names, descriptions, usage counts, which agents have them attached |
| **Skill usage** | Per-event skill usage log with timestamps, actions (view, use, edit), and which agent or member triggered it |
| **Files** | Files produced by agents, filenames, scopes, creation timestamps |
| **Evaluations** | Chat quality evaluations: grade, sentiment, goal completion, and per-agent breakdowns |
| **Evaluation settings** | Which agents have evaluations enabled, plus model, frequency, and language |
| **Knowledge sources** | Connected Company Brain sources: type, status, and scope (personal, team, organization) |
| **Credits** | Authoritative credit-spend ledger by category, member, team, and model charged |
### Example questions
```text theme={"dark"}
How many credits has our organization used in the last 30 days?
Break it down by member.
```
```text theme={"dark"}
Show me daily credit consumption for the past 3 months as a chart.
```
```text theme={"dark"}
Break down credit spend by category for the last 30 days.
```
```text theme={"dark"}
Which members have been most active in the last 7 days?
Show their workflow runs and agent chats separately.
```
```text theme={"dark"}
What are our top 10 most-run workflows this month? Show credit cost for each.
```
```text theme={"dark"}
How many agent chats happened last week? Which agents are most popular?
```
```text theme={"dark"}
What are the most used MCP servers this week?
```
```text theme={"dark"}
How many active triggers do we have? Break them down by type.
```
```text theme={"dark"}
Which triggers fire most frequently this month?
```
```text theme={"dark"}
Show me all Slack-based triggers and which agents they belong to.
```
```text theme={"dark"}
What are our most-used skills in the last 30 days?
```
```text theme={"dark"}
Which agents have the most skills attached?
```
```text theme={"dark"}
Show me skill usage trends over the past month, grouped by action type.
```
```text theme={"dark"}
How many files were created by agents this week?
```
```text theme={"dark"}
Which agents produce the most files? Show the top 5.
```
```text theme={"dark"}
Show me file creation volume per day for the last 30 days.
```
```text theme={"dark"}
How many agent chats were graded needs review or needs attention in the last 30 days?
```
```text theme={"dark"}
Which agents have the lowest evaluation success rate this month?
```
```text theme={"dark"}
How many agents have evaluations enabled? Break it down by model.
```
```text theme={"dark"}
How many knowledge sources are connected across the organization?
```
```text theme={"dark"}
Break down our knowledge sources by type and status.
```
```text theme={"dark"}
Which knowledge sources are currently in an error state?
```
***
## Impact Reports
Rather than checking the dashboard, have it delivered. Click **Impact Report** in the Insights toolbar to schedule a recurring summary of your organization's agent activity.
| Setting | Options |
| ------------------ | --------------------------------------------------------- |
| **Cadence** | Weekly or monthly |
| **Email** | Any number of recipient addresses |
| **Slack** | Channels, plus direct messages to specific members |
| **Send me a test** | Sends the report to you immediately so you can preview it |
Only Slack channels the Gumloop bot has joined can be selected. Use **Disable report** in the same panel to stop delivery.
Reports cover the most recently completed period (weeks and months close in UTC) and go out after it closes — emails arrive at 10:00 in each recipient's local time where that is known. Each report's numbers are snapshotted when it is generated, so a retry delivers the same figures.
 Anyone who can open Insights can view the report settings; **Admins**, **Managers**, and the **Analytics** role can
enable, edit, and test-send it. The written summary in each report is generated by an AI model and is billed to your
organization as AI utility credits.
## Per-agent Insights
Every [agent](/core-concepts/agents) has its own Insights view at **Agent > Insights**, for owners who only care about their own agent. It uses the same date range picker and shows:
* Headline KPIs and a credit spend and volume chart, with the previous period for comparison
* Breakdowns by task source, skill, artifact type, Slack channel, member, and model
* Its own Impact Report schedule, independent of the organization-wide one
## FAQ
Access comes from the [organization role](/core-concepts/organization_user_roles) a member holds, assigned under
[Settings > Organization > Members](https://www.gumloop.com/settings/organization/members). **Admin**, **Manager**,
and the **Analytics** role can open Insights. **Member**, **Security**, and **Developer** cannot — the page is not in
their navigation.
Roles are additive, so if someone needs reporting and nothing else, add **Analytics** to their existing Member role
rather than promoting them to Manager.
Yes. Insights and Impact Reports are Enterprise features — on other plans the analytics roles cannot grant access to
them.
Everyone who can open Insights sees the same organization-wide dashboards — the tabs are not filtered per person.
The analytics agent is different: it answers across the whole organization only for **Admins**. For a **Manager** or
the **Analytics** role, the agent answers about that person's own activity, because the scope is applied when the
query is built rather than filtered afterwards. Use the dashboards and Explorer for organization-wide numbers.
**Admin**, **Manager**, and the **Analytics** role can enable, edit, and test-send the organization's Impact Report.
Anyone who can open Insights can see the current settings.
Completed days come from a rollup that refreshes hourly, and today's activity is read live, so the current day is
always current. Recent closed days are recomputed for a few days afterwards to pick up late-arriving records, so a
yesterday figure can still move slightly.
Days are counted in **UTC** — for both the dashboards and the periods Impact Reports cover — so an Insights "day"
may not line up with your local day.
Browsing the dashboards costs nothing. Questions you ask the analytics agent are charged on the amount of data the
query scans, and the written summary in each Impact Report is billed as AI utility credits. See
[Credits](/core-concepts/credits) for how spend is tracked.
The agent keeps its own cost low by aggregating instead of returning raw rows and, when your question doesn't name a
period, limiting time-series tables to the last 90 days. To look further back, state the date range in your question
— that default applies only to the agent, never to the dashboards, whose range you set in the toolbar.
Every query is scoped to your organization and built against a fixed set of analytics tables and columns — there is
no arbitrary SQL, values are passed as query parameters rather than pasted into the SQL text, and the organization
and user filters are part of the query itself. Asking the agent to ignore those rules, or to role-play around them,
does not change what it can read.
## Related resources
Export raw usage data as CSV for external analysis
Manage which AI models are available in your organization
Configure granular permissions and access controls
Track user actions and system events for compliance
Anyone who can open Insights can view the report settings; **Admins**, **Managers**, and the **Analytics** role can
enable, edit, and test-send it. The written summary in each report is generated by an AI model and is billed to your
organization as AI utility credits.
## Per-agent Insights
Every [agent](/core-concepts/agents) has its own Insights view at **Agent > Insights**, for owners who only care about their own agent. It uses the same date range picker and shows:
* Headline KPIs and a credit spend and volume chart, with the previous period for comparison
* Breakdowns by task source, skill, artifact type, Slack channel, member, and model
* Its own Impact Report schedule, independent of the organization-wide one
## FAQ
Access comes from the [organization role](/core-concepts/organization_user_roles) a member holds, assigned under
[Settings > Organization > Members](https://www.gumloop.com/settings/organization/members). **Admin**, **Manager**,
and the **Analytics** role can open Insights. **Member**, **Security**, and **Developer** cannot — the page is not in
their navigation.
Roles are additive, so if someone needs reporting and nothing else, add **Analytics** to their existing Member role
rather than promoting them to Manager.
Yes. Insights and Impact Reports are Enterprise features — on other plans the analytics roles cannot grant access to
them.
Everyone who can open Insights sees the same organization-wide dashboards — the tabs are not filtered per person.
The analytics agent is different: it answers across the whole organization only for **Admins**. For a **Manager** or
the **Analytics** role, the agent answers about that person's own activity, because the scope is applied when the
query is built rather than filtered afterwards. Use the dashboards and Explorer for organization-wide numbers.
**Admin**, **Manager**, and the **Analytics** role can enable, edit, and test-send the organization's Impact Report.
Anyone who can open Insights can see the current settings.
Completed days come from a rollup that refreshes hourly, and today's activity is read live, so the current day is
always current. Recent closed days are recomputed for a few days afterwards to pick up late-arriving records, so a
yesterday figure can still move slightly.
Days are counted in **UTC** — for both the dashboards and the periods Impact Reports cover — so an Insights "day"
may not line up with your local day.
Browsing the dashboards costs nothing. Questions you ask the analytics agent are charged on the amount of data the
query scans, and the written summary in each Impact Report is billed as AI utility credits. See
[Credits](/core-concepts/credits) for how spend is tracked.
The agent keeps its own cost low by aggregating instead of returning raw rows and, when your question doesn't name a
period, limiting time-series tables to the last 90 days. To look further back, state the date range in your question
— that default applies only to the agent, never to the dashboards, whose range you set in the toolbar.
Every query is scoped to your organization and built against a fixed set of analytics tables and columns — there is
no arbitrary SQL, values are passed as query parameters rather than pasted into the SQL text, and the organization
and user filters are part of the query itself. Asking the agent to ignore those rules, or to role-play around them,
does not change what it can read.
## Related resources
Export raw usage data as CSV for external analysis
Manage which AI models are available in your organization
Configure granular permissions and access controls
Track user actions and system events for compliance