> ## Documentation Index
> Fetch the complete documentation index at: https://docs.gumloop.com/llms.txt
> Use this file to discover all available pages before exploring further.
# Organization Analytics
Organization Analytics gives enterprise organizations a centralized place to track adoption, performance, and outcomes. It combines a built-in dashboard with an AI-powered conversational interface, so you can explore your organization's data without writing SQL or building reports.
## Overview
The analytics page at [Settings > Organization > Analytics](https://www.gumloop.com/settings/organization/analytics) has two parts: a conversational explorer and a dashboard overview.
 ### Conversational Explorer
At the top of the page, you can ask questions in natural language. Type a question or pick from the suggested prompts to get instant answers about your organization's activity.
Suggested prompts include:
* **Who are my top 3 most active users this week?**
* **What are the most used agents this week?**
* **What are the most used MCP servers this week?**
The AI agent connects to your organization's data and returns results as tables, charts, or CSV exports.
### Dashboard Overview
Below the conversational explorer, the dashboard provides at-a-glance metrics for your organization. Use the date range picker to adjust the time window.
Key metrics include:
* **Credits Used Over Time**: A chart showing total credit consumption across the selected period.
Monitor credit consumption across users, workflows, and agents over any time period
Understand which workflows and agents are most active and who is using them
See which team members are running workflows, chatting with agents, and consuming credits
Generate charts and download CSV exports for stakeholder reporting
## How to Access
### In the Dashboard
Navigate to [Settings > Organization > Analytics](https://www.gumloop.com/settings/organization/analytics) to access the full analytics page with both the conversational explorer and the dashboard overview.
### In Slack
You can also use the analytics agent directly in Slack:
Invite the Gumloop bot to the Slack channel where you want to use analytics.
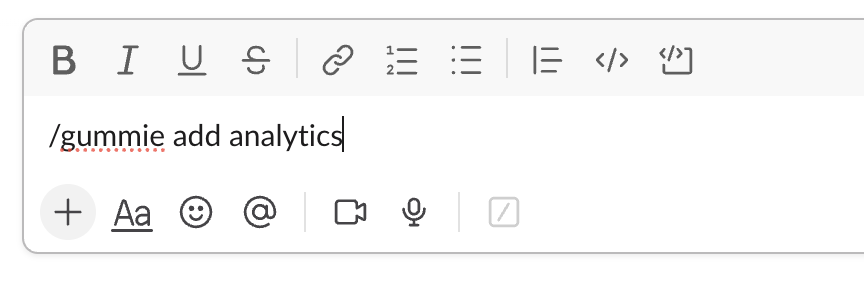
Type `/gummie add analytics` in the channel to activate the analytics agent.
### Conversational Explorer
At the top of the page, you can ask questions in natural language. Type a question or pick from the suggested prompts to get instant answers about your organization's activity.
Suggested prompts include:
* **Who are my top 3 most active users this week?**
* **What are the most used agents this week?**
* **What are the most used MCP servers this week?**
The AI agent connects to your organization's data and returns results as tables, charts, or CSV exports.
### Dashboard Overview
Below the conversational explorer, the dashboard provides at-a-glance metrics for your organization. Use the date range picker to adjust the time window.
Key metrics include:
* **Credits Used Over Time**: A chart showing total credit consumption across the selected period.
Monitor credit consumption across users, workflows, and agents over any time period
Understand which workflows and agents are most active and who is using them
See which team members are running workflows, chatting with agents, and consuming credits
Generate charts and download CSV exports for stakeholder reporting
## How to Access
### In the Dashboard
Navigate to [Settings > Organization > Analytics](https://www.gumloop.com/settings/organization/analytics) to access the full analytics page with both the conversational explorer and the dashboard overview.
### In Slack
You can also use the analytics agent directly in Slack:
Invite the Gumloop bot to the Slack channel where you want to use analytics.
Type `/gummie add analytics` in the channel to activate the analytics agent.
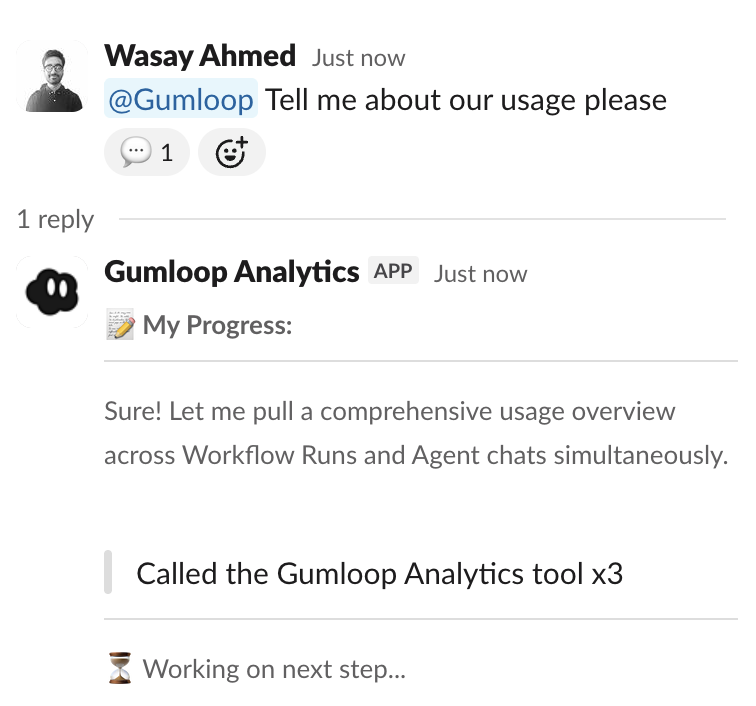
 Mention **@Gumloop** in the channel and ask your analytics questions. The agent will respond with results directly in the thread.
 ## Chat History
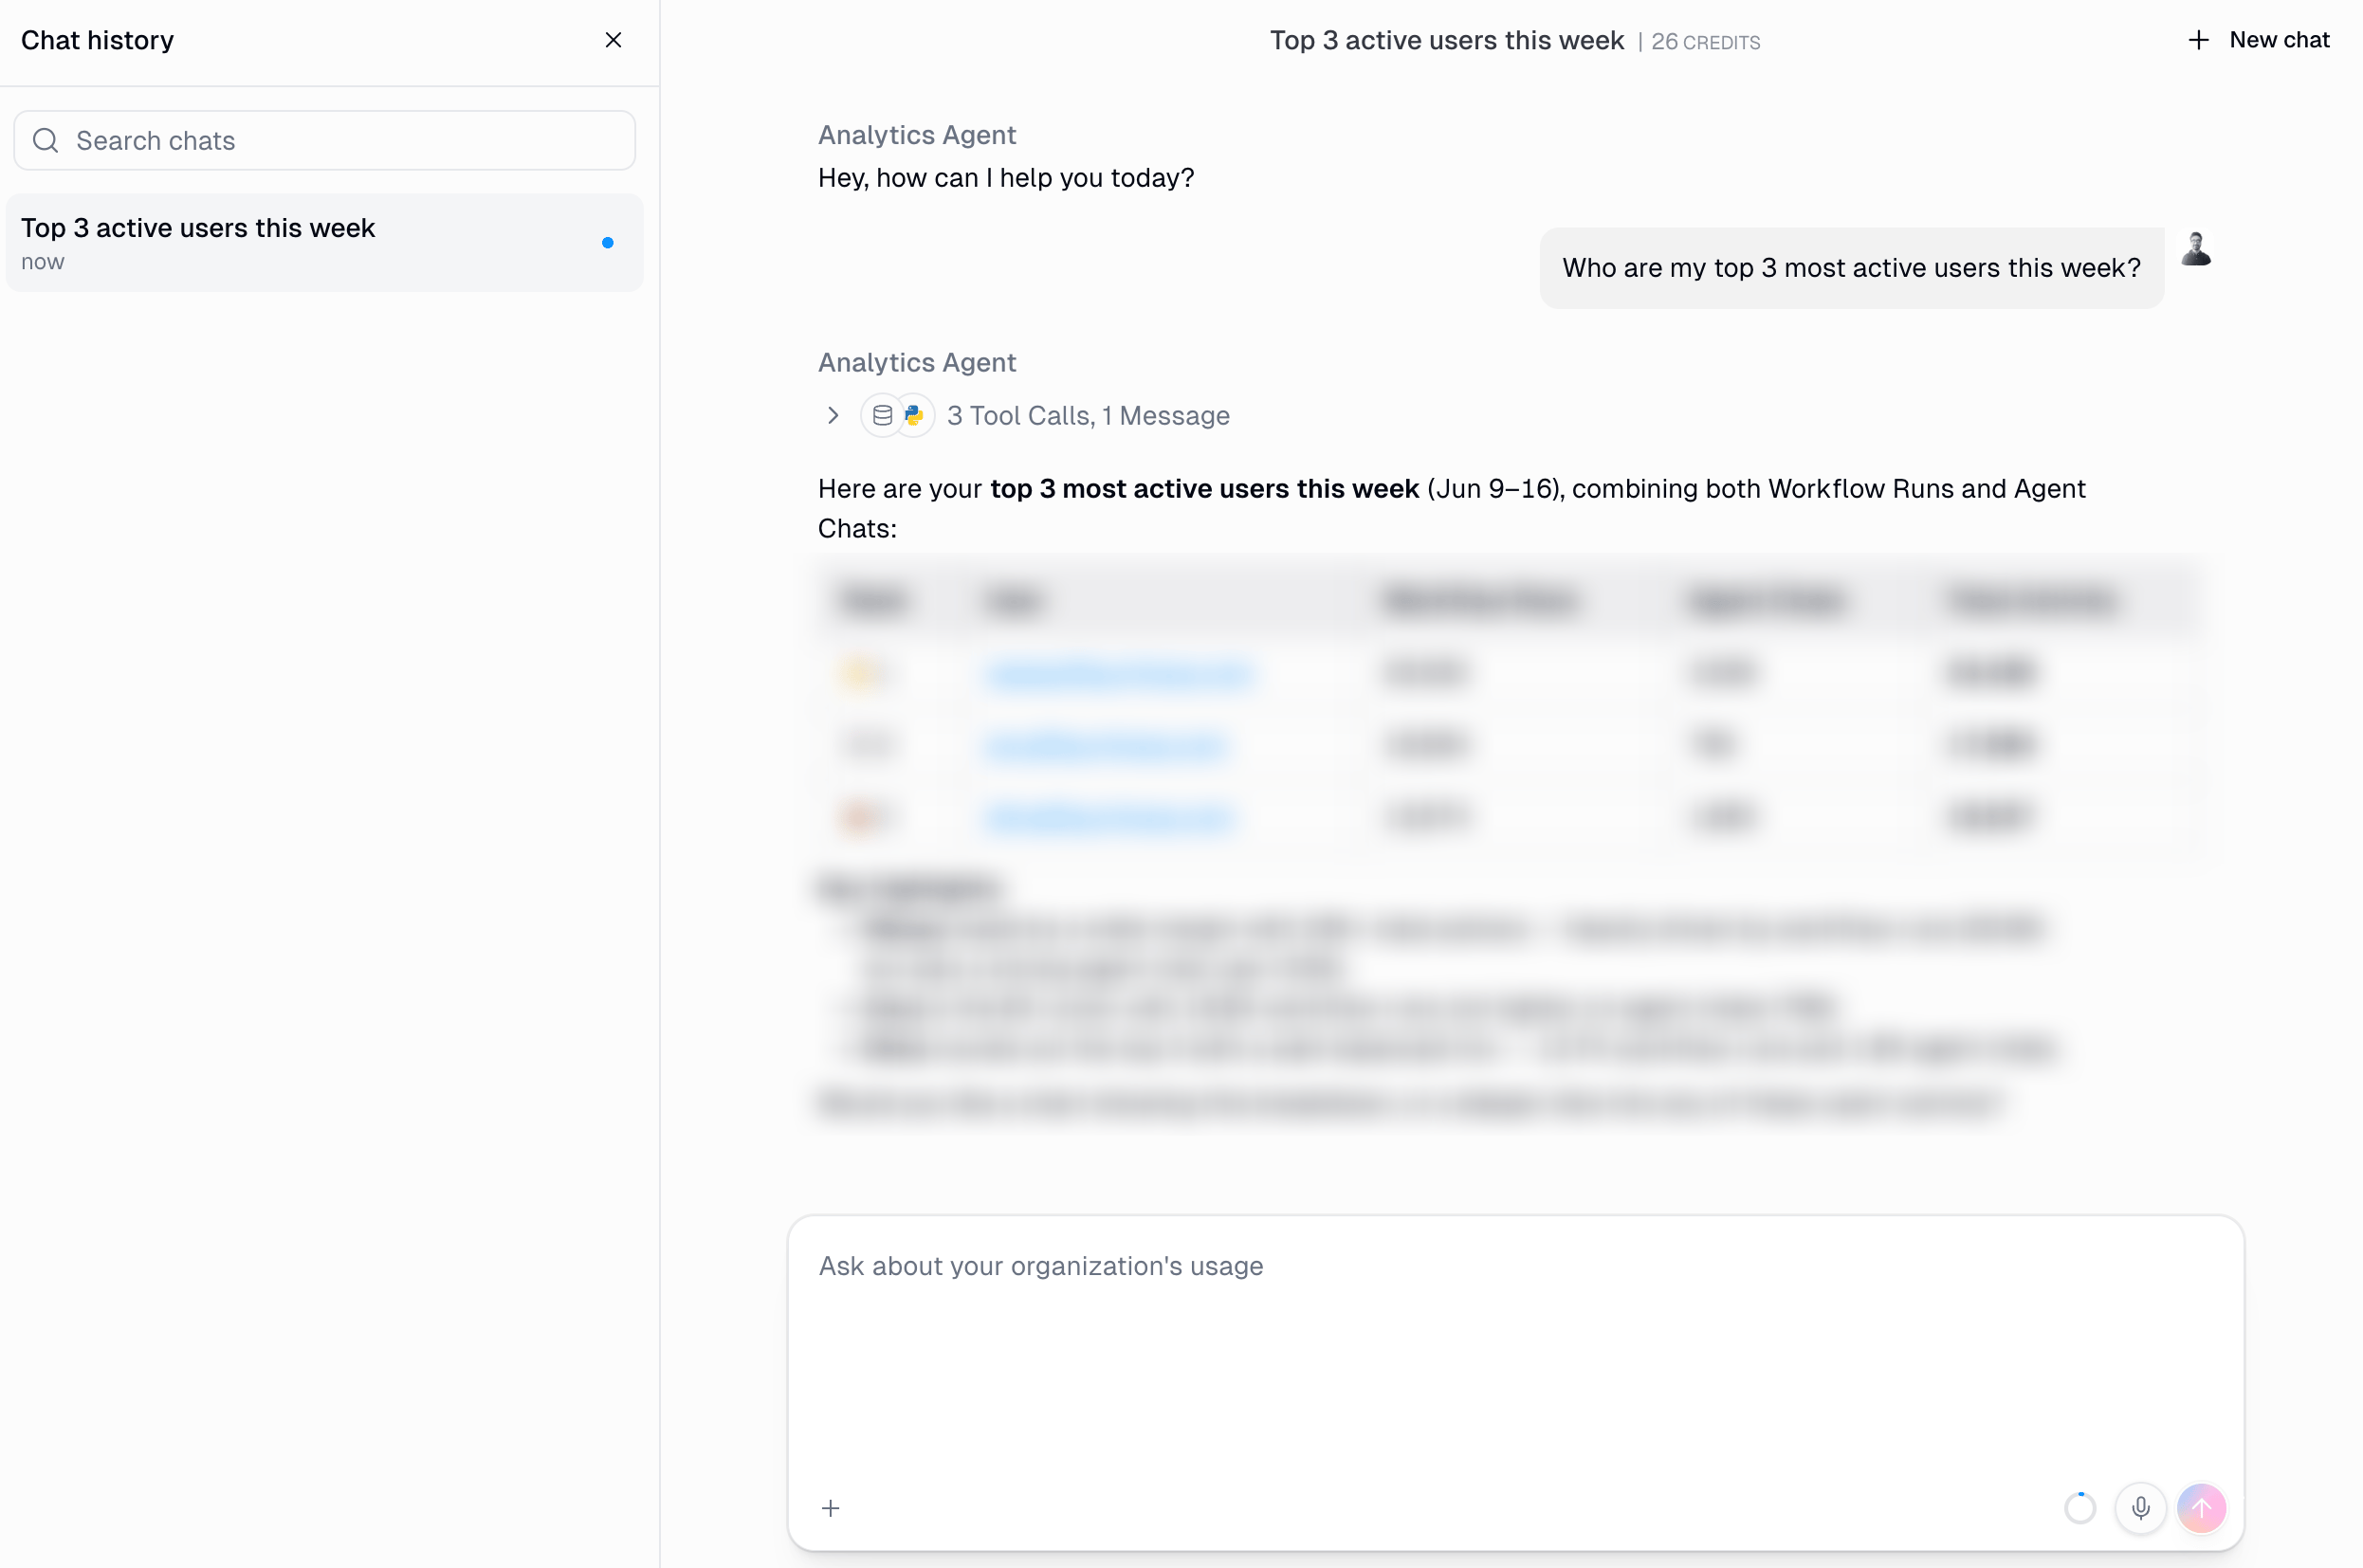
Your conversations with the analytics agent are saved and accessible from the chat history sidebar. You can revisit previous queries, continue where you left off, or start a new chat at any time.
## Chat History
Your conversations with the analytics agent are saved and accessible from the chat history sidebar. You can revisit previous queries, continue where you left off, or start a new chat at any time.
 Chat history is tied to your analytics permissions. If your VIEW\_ANALYTICS access is revoked, you also lose access to past analytics conversations.
***
## What You Can Ask
The analytics agent has access to the following data about your organization:
| Data | What It Covers |
| ----------------- | ------------------------------------------------------------------------------------------------------- |
| **Workflow Runs** | Run history, credit costs, execution counts, completion timestamps |
| **Agent Chats** | Chat sessions with agents, credit costs per chat, chat volume over time |
| **Agents** | Agent names, descriptions, models used, tools configured, creator info |
| **Workflows** | Workflow names, descriptions, creator info |
| **Users** | User emails and activity across your organization |
| **MCP Servers** | MCP server usage across your organization |
| **Triggers** | Agent trigger configurations, types (scheduled, email, Slack, webhooks, polling), status |
| **Skills** | Skill names, descriptions, usage counts, which agents have them attached |
| **Skill Usage** | Per-event skill usage log with timestamps, actions (view, use, edit), and which agent/user triggered it |
| **Files** | Files produced by agents, filenames, scopes, creation timestamps |
### Example Questions
```text theme={"dark"}
How many credits has our organization used in the last 30 days?
Break it down by user.
```
```text theme={"dark"}
Show me daily credit consumption for the past 3 months as a chart.
```
```text theme={"dark"}
Which users have been most active in the last 7 days?
Show their workflow runs and agent chats separately.
```
```text theme={"dark"}
What are our top 10 most-run workflows this month? Show credit cost for each.
```
```text theme={"dark"}
How many agent chats happened last week? Which agents are most popular?
```
```text theme={"dark"}
What are the most used MCP servers this week?
```
```text theme={"dark"}
How many active triggers do we have? Break them down by type.
```
```text theme={"dark"}
Which triggers fire most frequently this month?
```
```text theme={"dark"}
Show me all Slack-based triggers and which agents they belong to.
```
```text theme={"dark"}
What are our most-used skills in the last 30 days?
```
```text theme={"dark"}
Which agents have the most skills attached?
```
```text theme={"dark"}
Show me skill usage trends over the past month, grouped by action type.
```
```text theme={"dark"}
How many files were created by agents this week?
```
```text theme={"dark"}
Which agents produce the most files? Show the top 5.
```
```text theme={"dark"}
Show me file creation volume per day for the last 30 days.
```
## Data Access and Permissions
Organization Analytics enforces role-based access to ensure data security:
| Role | Data Scope |
| ----------- | --------------------------------------------------------------------------------------- |
| **Admin** | Full access to all organization-wide data across all users |
| **Manager** | Full access to all organization-wide data across all users |
| **Member** | Personal data only, can only see their own workflow runs, agent chats, and credit usage |
Non-admin and non-manager users are automatically scoped to their own data. They cannot query or view other users' activity, even if they explicitly ask for it.
## Security
Organization Analytics is built with multiple layers of data protection:
* **Organization isolation**: Every query is automatically scoped to your organization. The agent cannot access data from other organizations, even if prompted to do so.
* **Parameterized queries**: All queries use parameterized SQL. User input is never interpolated into query strings, preventing SQL injection.
* **Schema validation**: The agent can only query pre-defined tables and columns. It cannot run arbitrary SQL or access tables outside the analytics schema.
* **Role-based scoping**: Non-admin users are automatically filtered to their own data at the query level, not just at the display level.
* **Prompt injection protection**: The agent is designed to refuse attempts to bypass data access restrictions through prompt injection, role-play scenarios, or other techniques.
## Credit Usage
Queries made through the analytics agent consume credits based on the amount of data scanned. The agent is optimized to minimize data scanning by:
* Using aggregation queries instead of raw row dumps
* Applying automatic partition filters (defaulting to the last 90 days for time-series tables)
* Limiting result sets to only the data needed to answer your question
For time-range questions, the agent automatically applies efficient date filters. If you need data beyond the default 90-day window, specify the date range explicitly in your question.
## Related Resources
Export raw usage data as CSV for external analysis
Track user actions and system events for compliance
Configure granular permissions and access controls
Manage which AI models are available in your organization
Chat history is tied to your analytics permissions. If your VIEW\_ANALYTICS access is revoked, you also lose access to past analytics conversations.
***
## What You Can Ask
The analytics agent has access to the following data about your organization:
| Data | What It Covers |
| ----------------- | ------------------------------------------------------------------------------------------------------- |
| **Workflow Runs** | Run history, credit costs, execution counts, completion timestamps |
| **Agent Chats** | Chat sessions with agents, credit costs per chat, chat volume over time |
| **Agents** | Agent names, descriptions, models used, tools configured, creator info |
| **Workflows** | Workflow names, descriptions, creator info |
| **Users** | User emails and activity across your organization |
| **MCP Servers** | MCP server usage across your organization |
| **Triggers** | Agent trigger configurations, types (scheduled, email, Slack, webhooks, polling), status |
| **Skills** | Skill names, descriptions, usage counts, which agents have them attached |
| **Skill Usage** | Per-event skill usage log with timestamps, actions (view, use, edit), and which agent/user triggered it |
| **Files** | Files produced by agents, filenames, scopes, creation timestamps |
### Example Questions
```text theme={"dark"}
How many credits has our organization used in the last 30 days?
Break it down by user.
```
```text theme={"dark"}
Show me daily credit consumption for the past 3 months as a chart.
```
```text theme={"dark"}
Which users have been most active in the last 7 days?
Show their workflow runs and agent chats separately.
```
```text theme={"dark"}
What are our top 10 most-run workflows this month? Show credit cost for each.
```
```text theme={"dark"}
How many agent chats happened last week? Which agents are most popular?
```
```text theme={"dark"}
What are the most used MCP servers this week?
```
```text theme={"dark"}
How many active triggers do we have? Break them down by type.
```
```text theme={"dark"}
Which triggers fire most frequently this month?
```
```text theme={"dark"}
Show me all Slack-based triggers and which agents they belong to.
```
```text theme={"dark"}
What are our most-used skills in the last 30 days?
```
```text theme={"dark"}
Which agents have the most skills attached?
```
```text theme={"dark"}
Show me skill usage trends over the past month, grouped by action type.
```
```text theme={"dark"}
How many files were created by agents this week?
```
```text theme={"dark"}
Which agents produce the most files? Show the top 5.
```
```text theme={"dark"}
Show me file creation volume per day for the last 30 days.
```
## Data Access and Permissions
Organization Analytics enforces role-based access to ensure data security:
| Role | Data Scope |
| ----------- | --------------------------------------------------------------------------------------- |
| **Admin** | Full access to all organization-wide data across all users |
| **Manager** | Full access to all organization-wide data across all users |
| **Member** | Personal data only, can only see their own workflow runs, agent chats, and credit usage |
Non-admin and non-manager users are automatically scoped to their own data. They cannot query or view other users' activity, even if they explicitly ask for it.
## Security
Organization Analytics is built with multiple layers of data protection:
* **Organization isolation**: Every query is automatically scoped to your organization. The agent cannot access data from other organizations, even if prompted to do so.
* **Parameterized queries**: All queries use parameterized SQL. User input is never interpolated into query strings, preventing SQL injection.
* **Schema validation**: The agent can only query pre-defined tables and columns. It cannot run arbitrary SQL or access tables outside the analytics schema.
* **Role-based scoping**: Non-admin users are automatically filtered to their own data at the query level, not just at the display level.
* **Prompt injection protection**: The agent is designed to refuse attempts to bypass data access restrictions through prompt injection, role-play scenarios, or other techniques.
## Credit Usage
Queries made through the analytics agent consume credits based on the amount of data scanned. The agent is optimized to minimize data scanning by:
* Using aggregation queries instead of raw row dumps
* Applying automatic partition filters (defaulting to the last 90 days for time-series tables)
* Limiting result sets to only the data needed to answer your question
For time-range questions, the agent automatically applies efficient date filters. If you need data beyond the default 90-day window, specify the date range explicitly in your question.
## Related Resources
Export raw usage data as CSV for external analysis
Track user actions and system events for compliance
Configure granular permissions and access controls
Manage which AI models are available in your organization