> ## Documentation Index
> Fetch the complete documentation index at: https://docs.gumloop.com/llms.txt
> Use this file to discover all available pages before exploring further.
# App Activity
> Monitor tool calls, MCP interactions, and integration usage across your organization with real-time activity logs.
App Activity gives you a centralized, real-time view of every tool call made across all MCP servers in your organization. Whether you need to debug a failed integration, audit who accessed what, or track usage patterns, this is your go-to dashboard.
 ## Where to find it
Go to **Settings → Organization → App Activity** at
[gumloop.com/settings/organization/activity](https://gumloop.com/settings/organization/activity).
App Activity is an **Enterprise** feature. You need the **Admin** role to
view the full organization-wide activity log. Non-admin users will only see
their own activity.
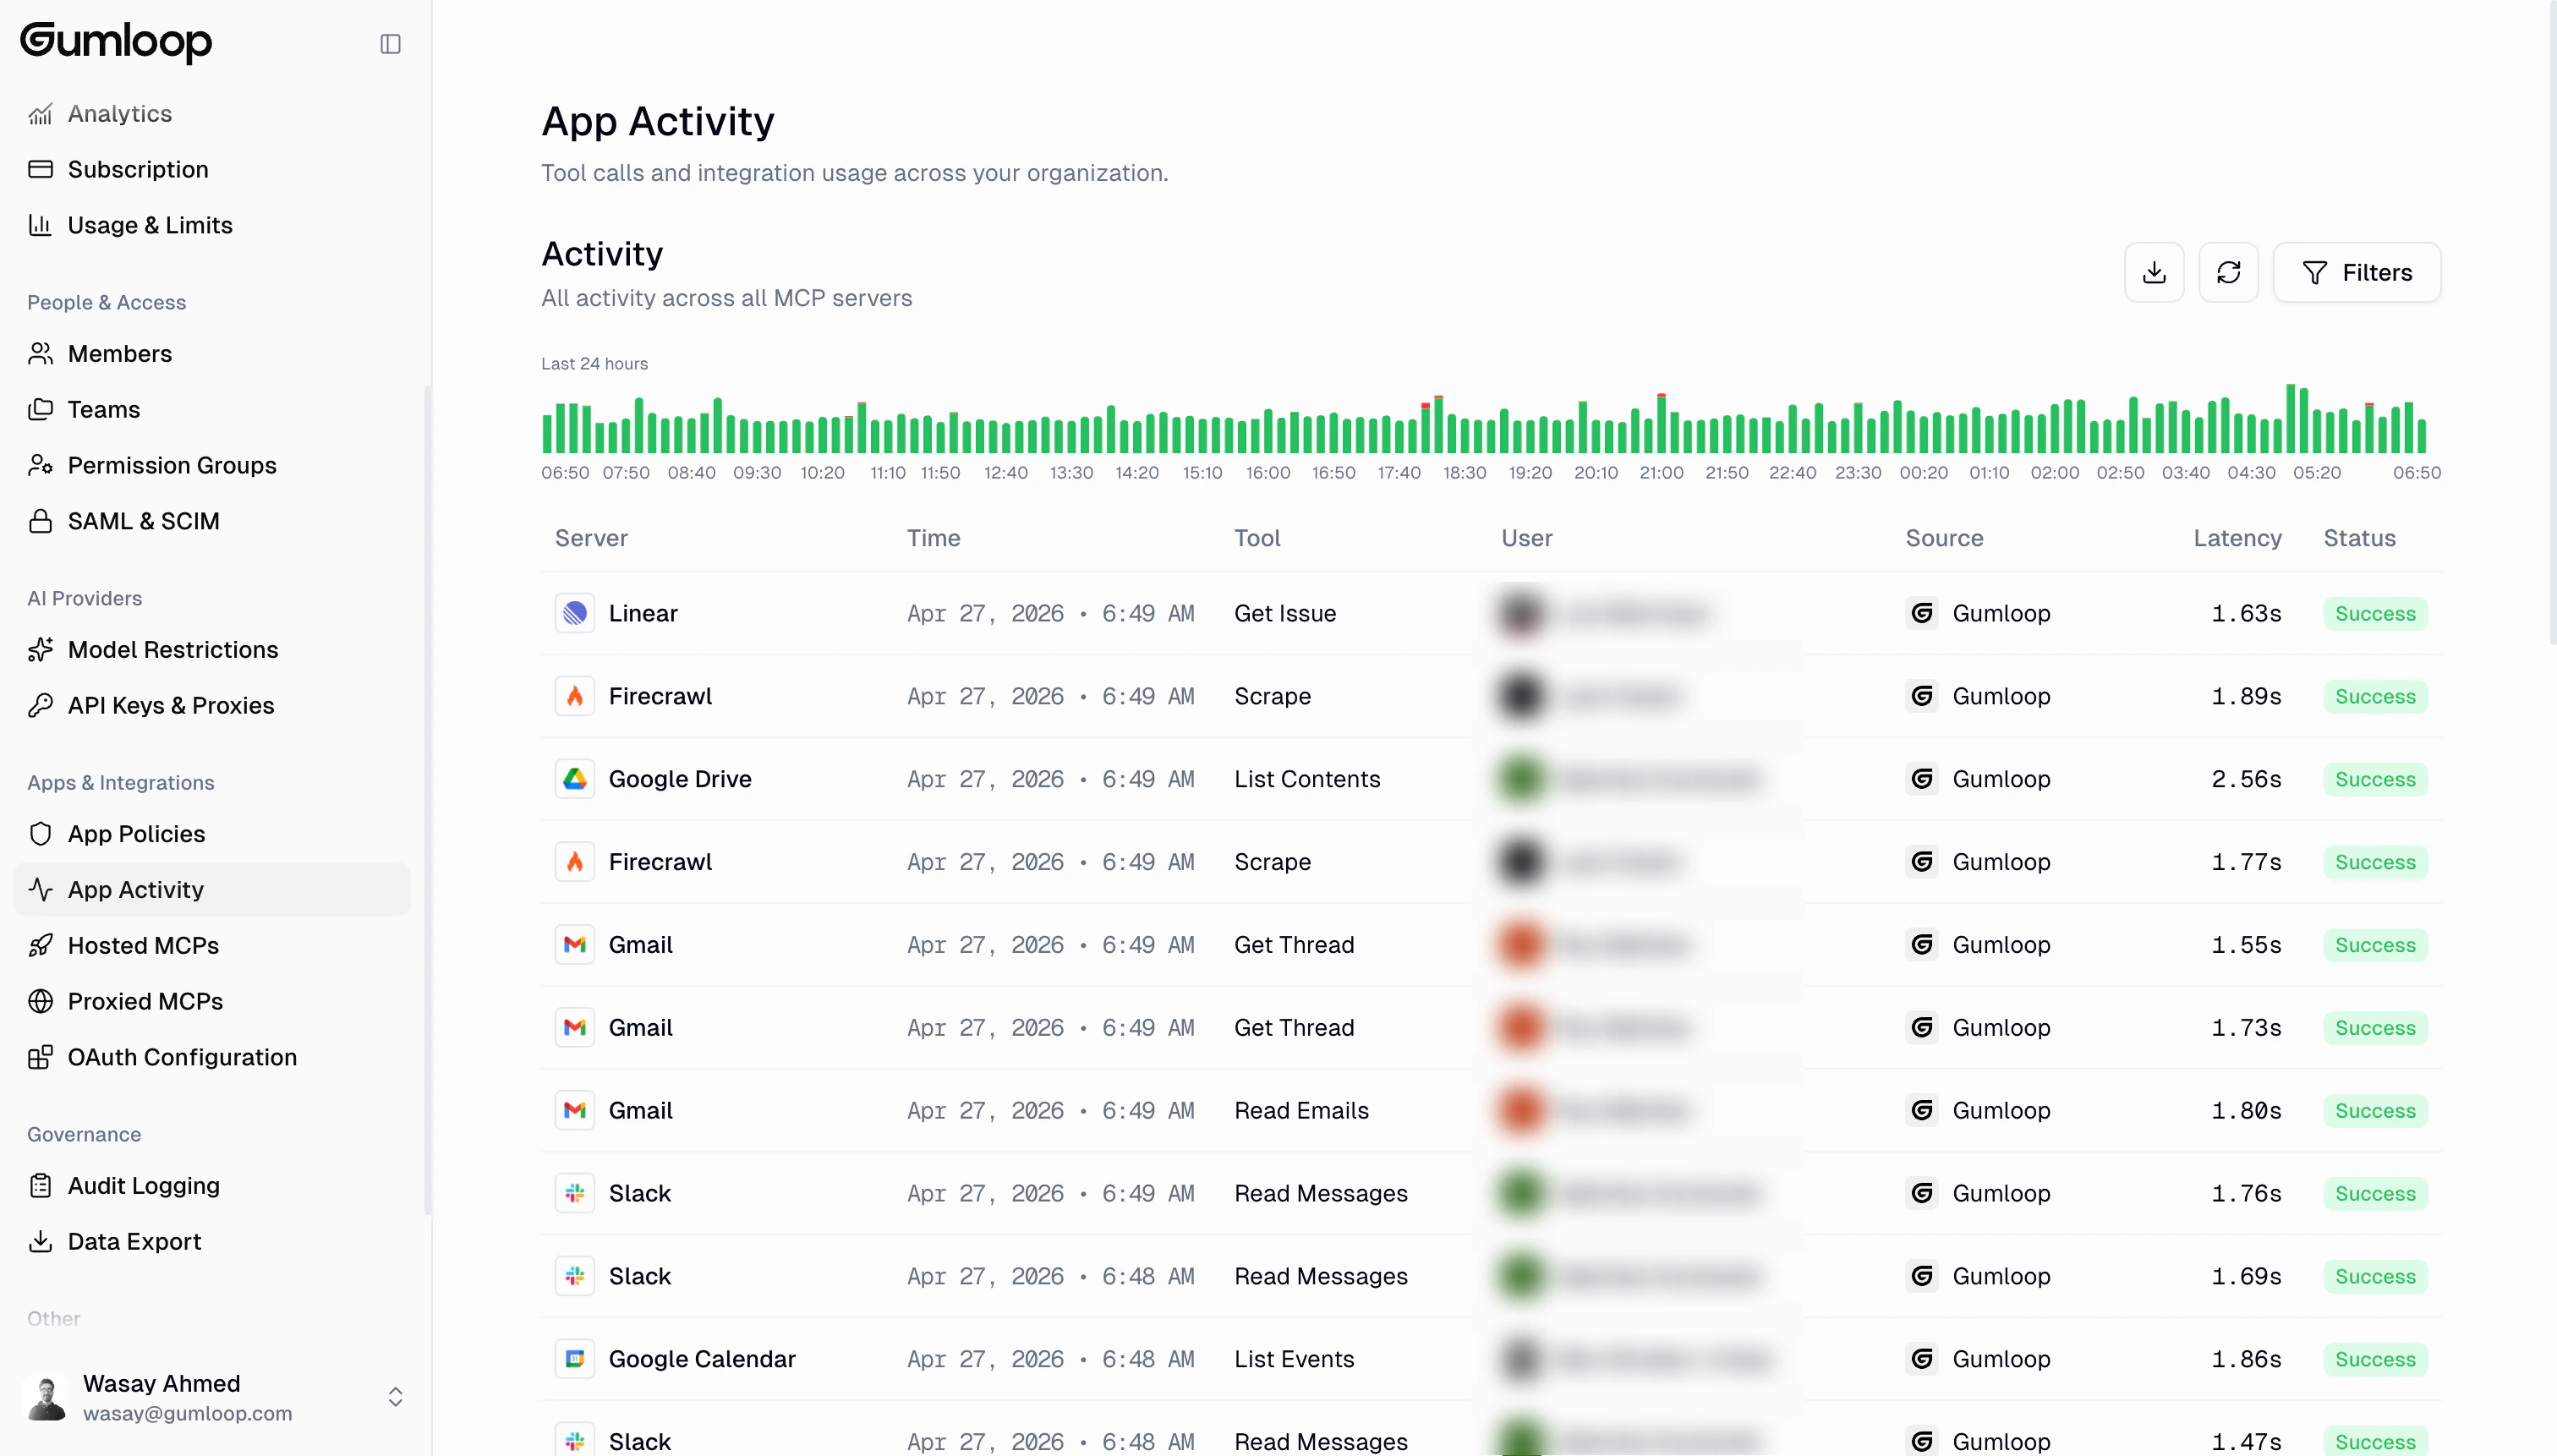
## Activity Histogram
At the top of the page, a histogram shows tool call volume over the last 24 hours. Each bar represents a time interval, color-coded by status:
* **Green**: Successful calls
* **Red**: Errors or blocked calls
## Where to find it
Go to **Settings → Organization → App Activity** at
[gumloop.com/settings/organization/activity](https://gumloop.com/settings/organization/activity).
App Activity is an **Enterprise** feature. You need the **Admin** role to
view the full organization-wide activity log. Non-admin users will only see
their own activity.
## Activity Histogram
At the top of the page, a histogram shows tool call volume over the last 24 hours. Each bar represents a time interval, color-coded by status:
* **Green**: Successful calls
* **Red**: Errors or blocked calls
 The histogram gives you a quick visual sense of activity patterns. Spikes in red can indicate integration issues worth investigating.
The histogram is visible when viewing the **Last 24 hours** date range.
Selecting a custom date range longer than 24 hours hides the histogram and
shows only the table.
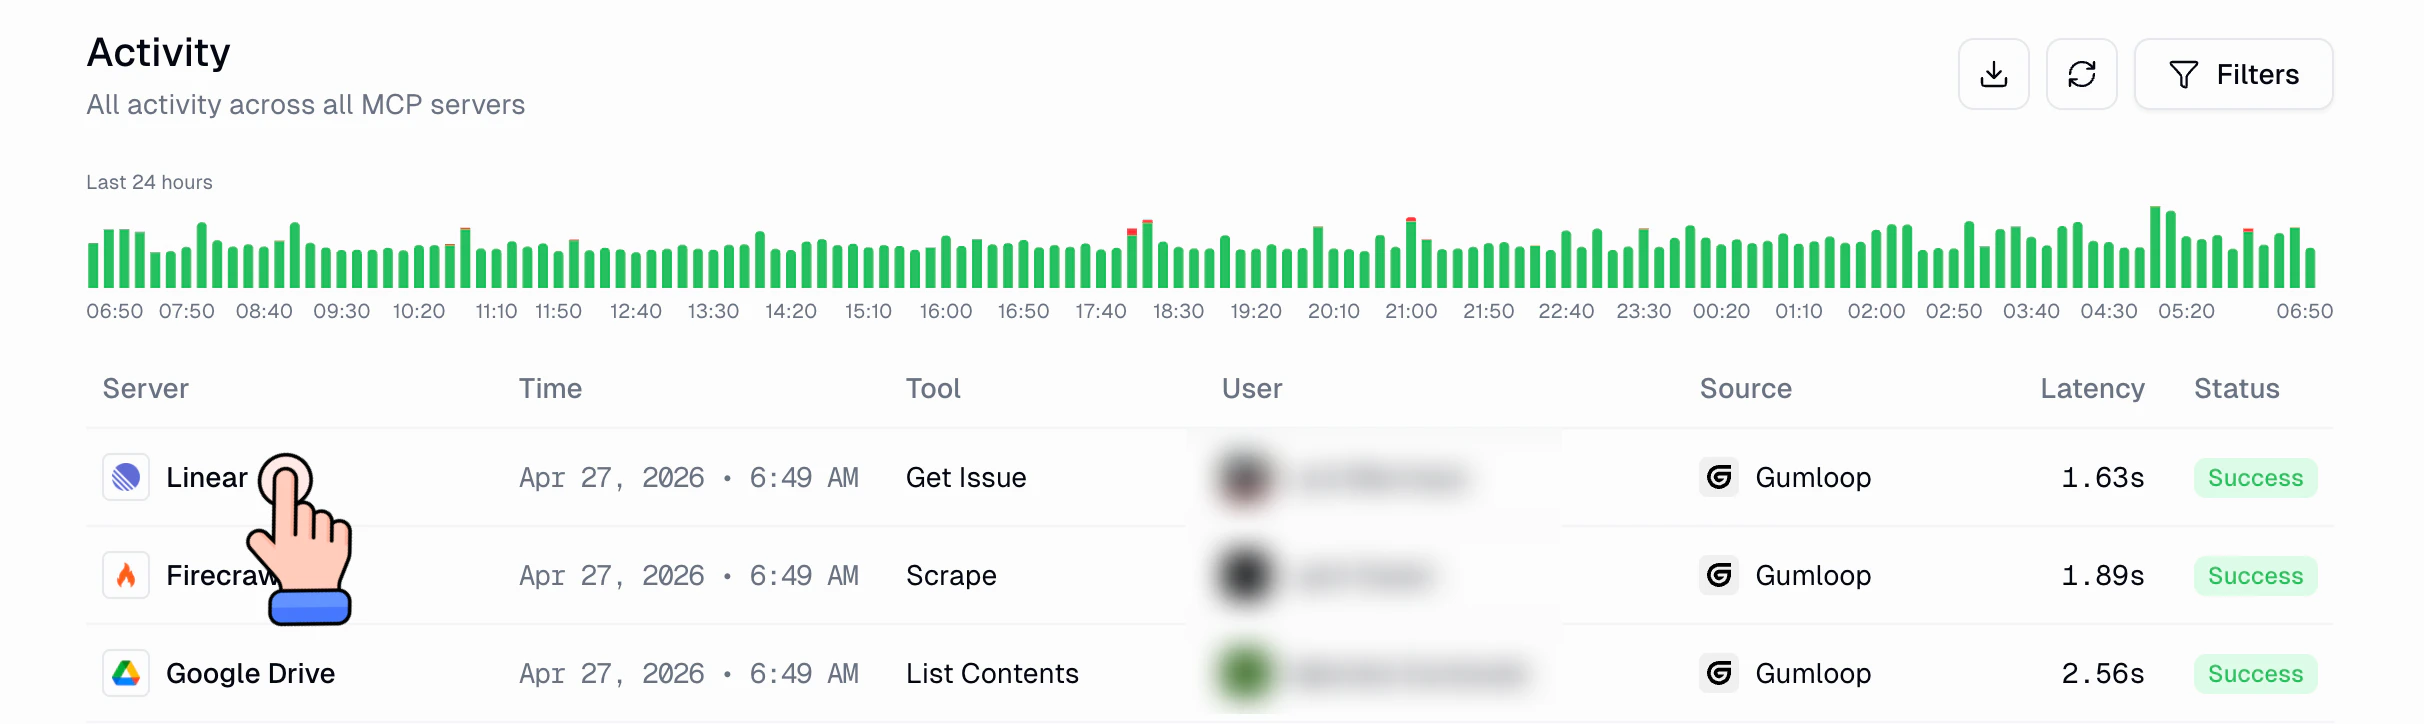
## Activity Table
Below the histogram, a table lists every tool call with these columns:
| Column | What it shows |
| ----------- | ----------------------------------------------------------------------------- |
| **Server** | The MCP server that handled the call (clickable, takes you to server details) |
| **Time** | When the call happened |
| **Tool** | Which specific tool was invoked (e.g., `Get Issue`, `Read Emails`) |
| **User** | Who triggered the call |
| **Source** | Where the call originated (e.g., Gumloop agent, workflow, external client) |
| **Latency** | Round-trip time for the call |
| **Status** | `Success`, `Error`, `Permission Denied`, or `In Progress` |
Clicking any server name in the table takes you directly to that server's detail page, where you can see server-specific activity, tools, and settings.
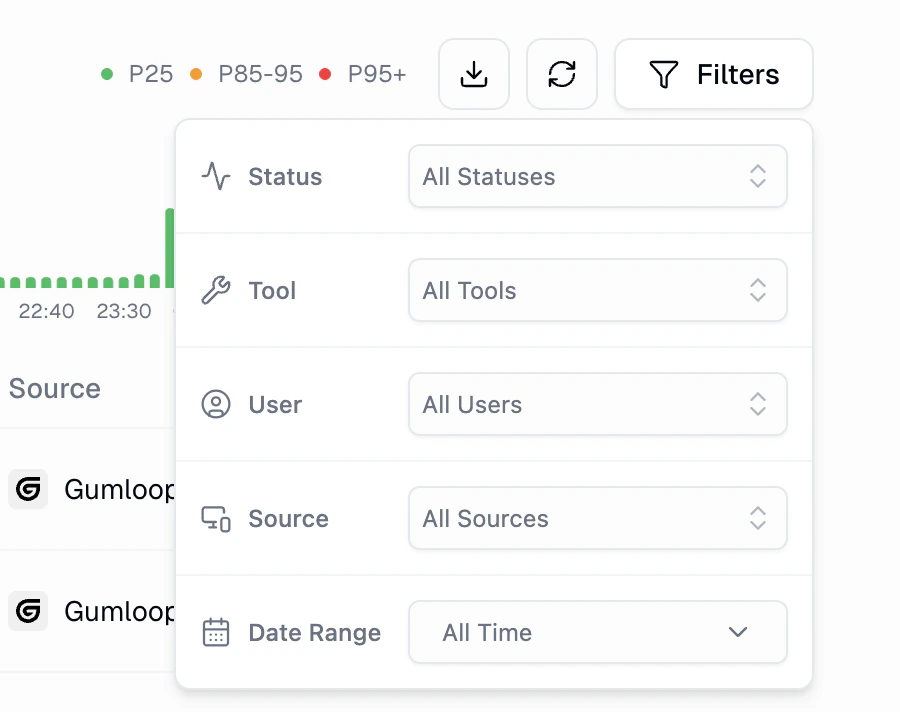
## Filtering Activity
Click the **Filters** button in the top right to narrow down what you see. You can filter by:
* **Status**: All Statuses, Success, Error, Permission Denied, or In Progress
* **Server**: Filter to a specific MCP server
* **Tool**: Filter to a specific tool name
* **User**: Filter to a specific user
* **Source**: Filter by where calls originated
* **Date Range**: All Time, Last 24 Hours, Last 7 Days, Last 30 Days, or a custom range
The histogram gives you a quick visual sense of activity patterns. Spikes in red can indicate integration issues worth investigating.
The histogram is visible when viewing the **Last 24 hours** date range.
Selecting a custom date range longer than 24 hours hides the histogram and
shows only the table.
## Activity Table
Below the histogram, a table lists every tool call with these columns:
| Column | What it shows |
| ----------- | ----------------------------------------------------------------------------- |
| **Server** | The MCP server that handled the call (clickable, takes you to server details) |
| **Time** | When the call happened |
| **Tool** | Which specific tool was invoked (e.g., `Get Issue`, `Read Emails`) |
| **User** | Who triggered the call |
| **Source** | Where the call originated (e.g., Gumloop agent, workflow, external client) |
| **Latency** | Round-trip time for the call |
| **Status** | `Success`, `Error`, `Permission Denied`, or `In Progress` |
Clicking any server name in the table takes you directly to that server's detail page, where you can see server-specific activity, tools, and settings.
## Filtering Activity
Click the **Filters** button in the top right to narrow down what you see. You can filter by:
* **Status**: All Statuses, Success, Error, Permission Denied, or In Progress
* **Server**: Filter to a specific MCP server
* **Tool**: Filter to a specific tool name
* **User**: Filter to a specific user
* **Source**: Filter by where calls originated
* **Date Range**: All Time, Last 24 Hours, Last 7 Days, Last 30 Days, or a custom range
 Combine filters to quickly find what you need. For example, filter by a
specific server and "Error" status to debug integration issues.
## Exporting Activity Data
Click the **download icon** (next to the Refresh and Filters buttons) to export the current filtered view as a CSV file. This is useful for compliance reporting, sharing with your team, or doing deeper analysis in a spreadsheet.
## Server Detail View
When you click into a specific server from the activity table, you see the **server detail page**. This includes a summary of the server's last 7 days of activity:
* **Total Calls**: Total tool calls for this server
* **Unique Users**: Number of distinct users who made calls
* **Error Rate**: Percentage of calls that returned errors
* **Avg Latency**: Average response time
Combine filters to quickly find what you need. For example, filter by a
specific server and "Error" status to debug integration issues.
## Exporting Activity Data
Click the **download icon** (next to the Refresh and Filters buttons) to export the current filtered view as a CSV file. This is useful for compliance reporting, sharing with your team, or doing deeper analysis in a spreadsheet.
## Server Detail View
When you click into a specific server from the activity table, you see the **server detail page**. This includes a summary of the server's last 7 days of activity:
* **Total Calls**: Total tool calls for this server
* **Unique Users**: Number of distinct users who made calls
* **Error Rate**: Percentage of calls that returned errors
* **Avg Latency**: Average response time
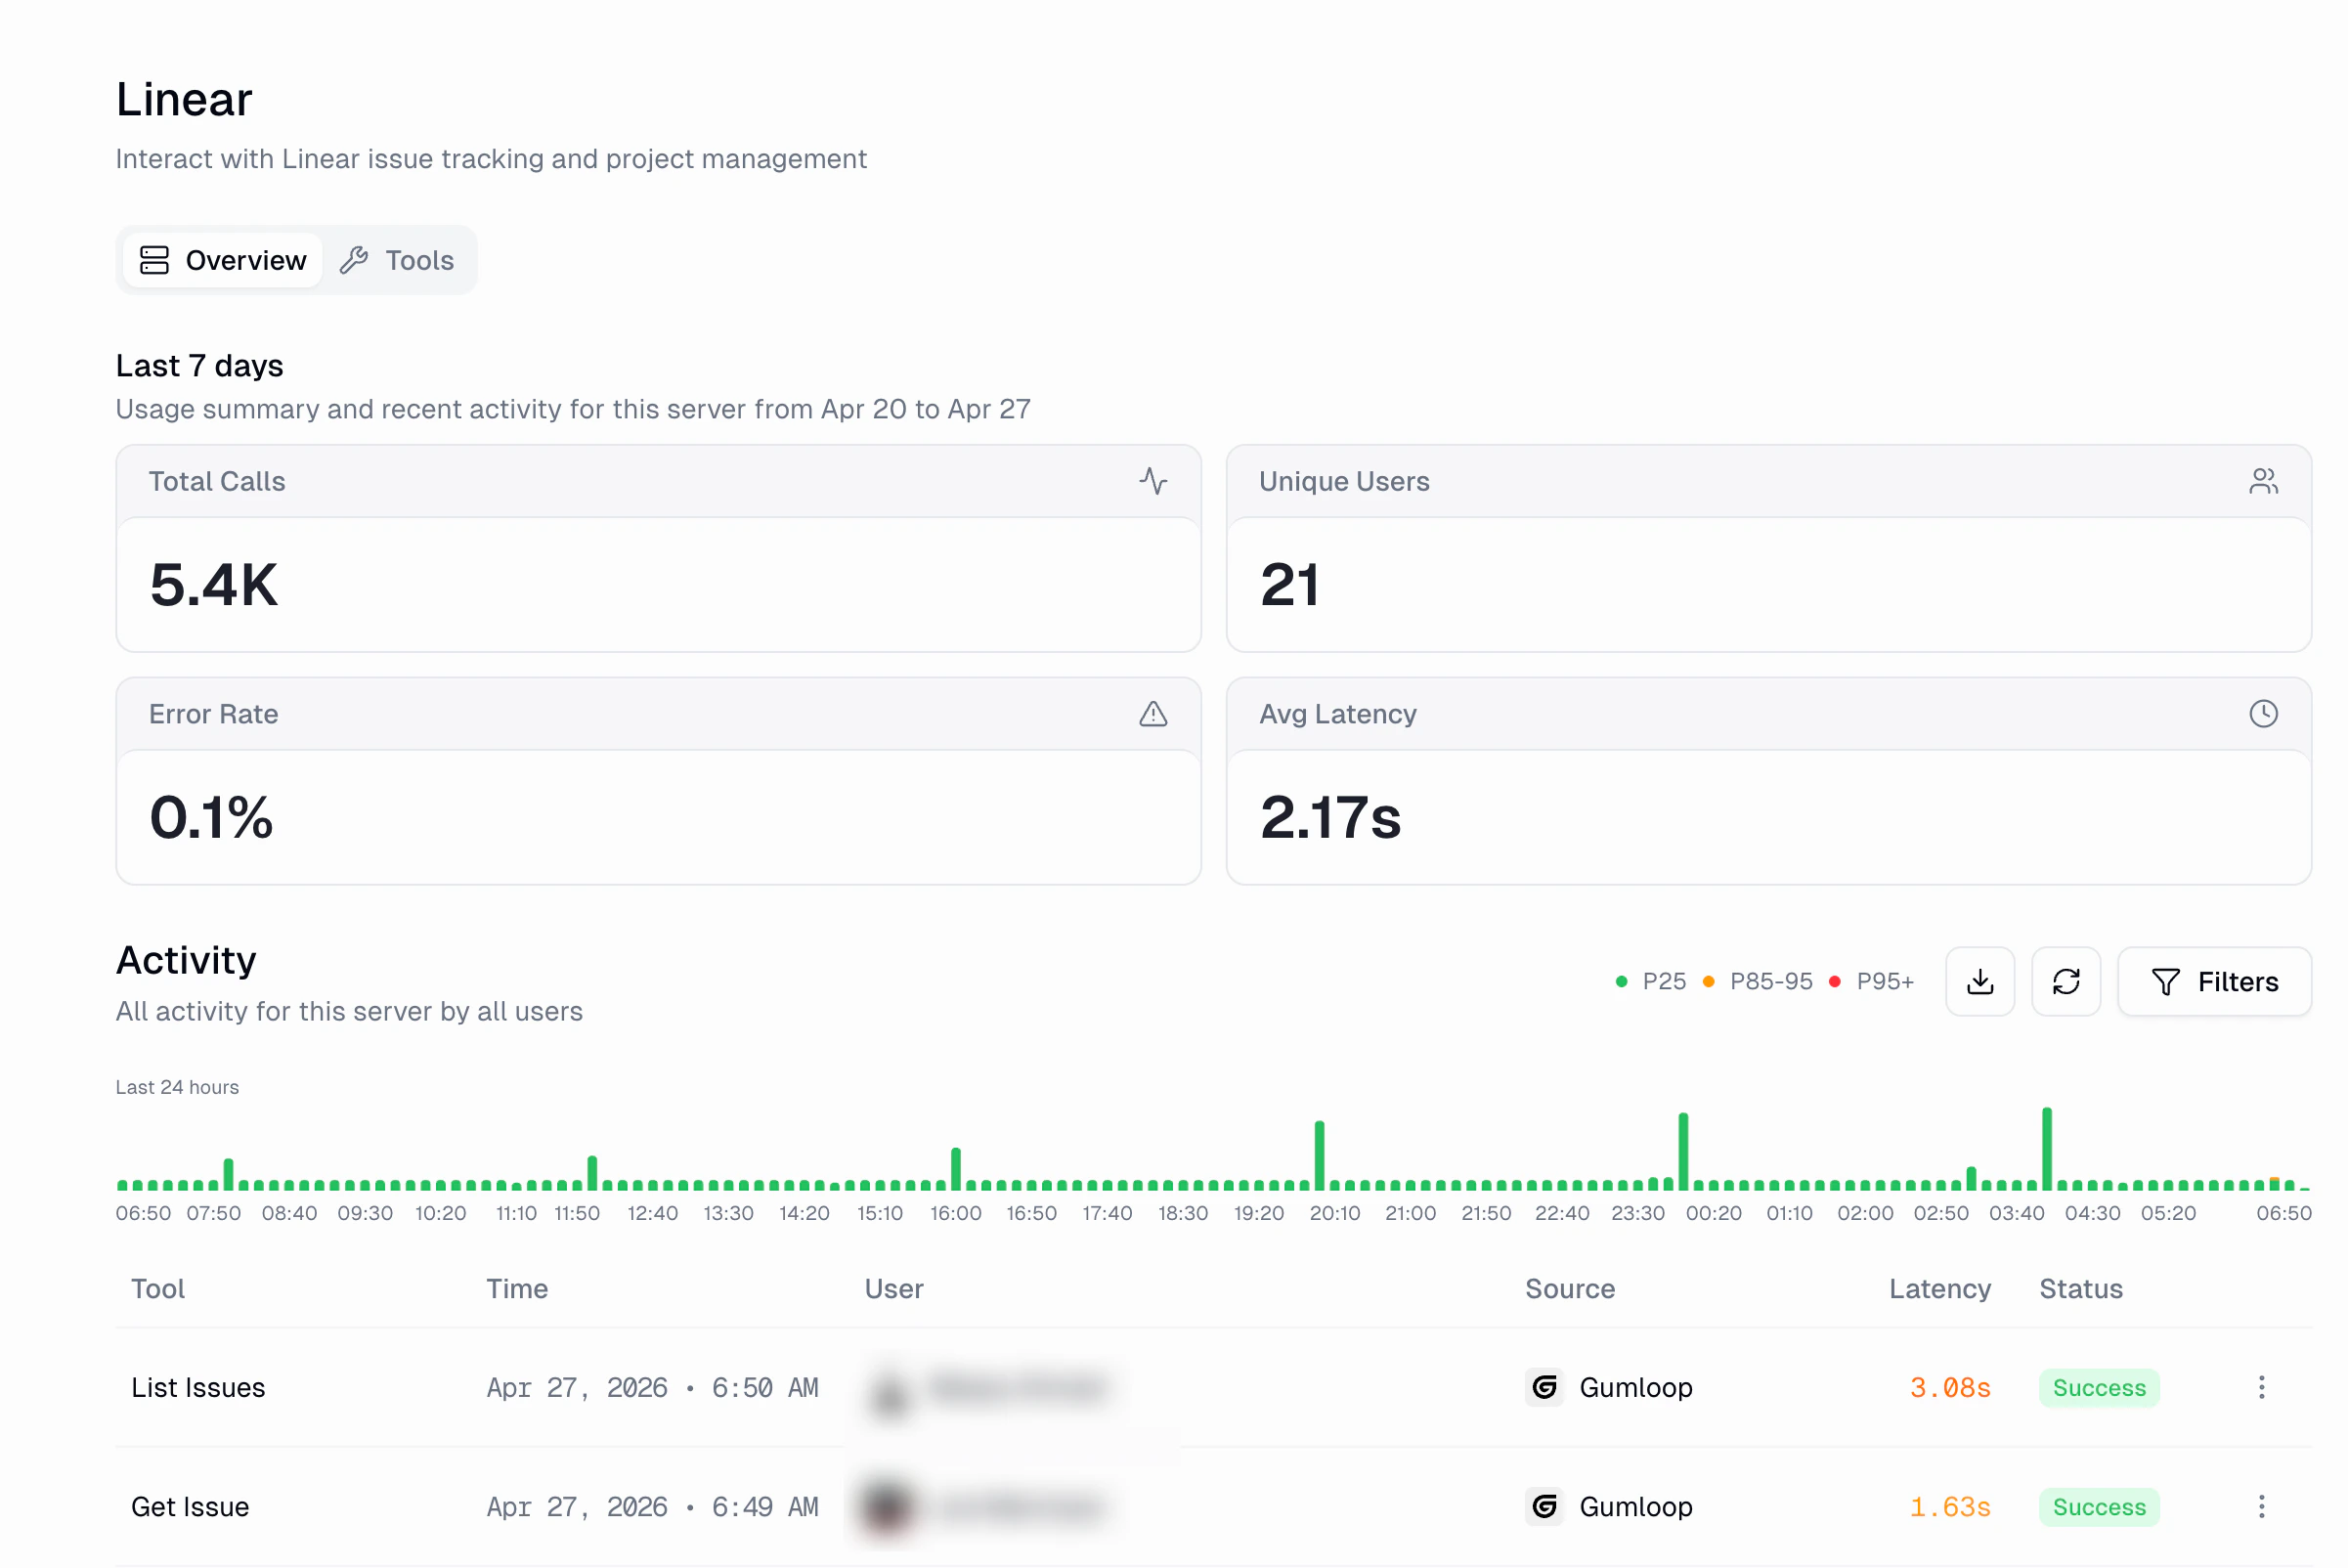 The server detail page also has its own activity histogram and table, scoped to just that server. The histogram here uses latency-based color coding:
* **Green (P25)**: Fast calls (25th percentile and below)
* **Orange (P85-95)**: Moderately slow calls
* **Red (P95+)**: The slowest calls
### Tools & Access
The **Tools** tab on any server detail page shows every tool discovered on that server, along with a custom-role matrix. This lets you control exactly which [custom roles](/enterprise-features/user_groups) can use which tools.
The server detail page also has its own activity histogram and table, scoped to just that server. The histogram here uses latency-based color coding:
* **Green (P25)**: Fast calls (25th percentile and below)
* **Orange (P85-95)**: Moderately slow calls
* **Red (P95+)**: The slowest calls
### Tools & Access
The **Tools** tab on any server detail page shows every tool discovered on that server, along with a custom-role matrix. This lets you control exactly which [custom roles](/enterprise-features/user_groups) can use which tools.
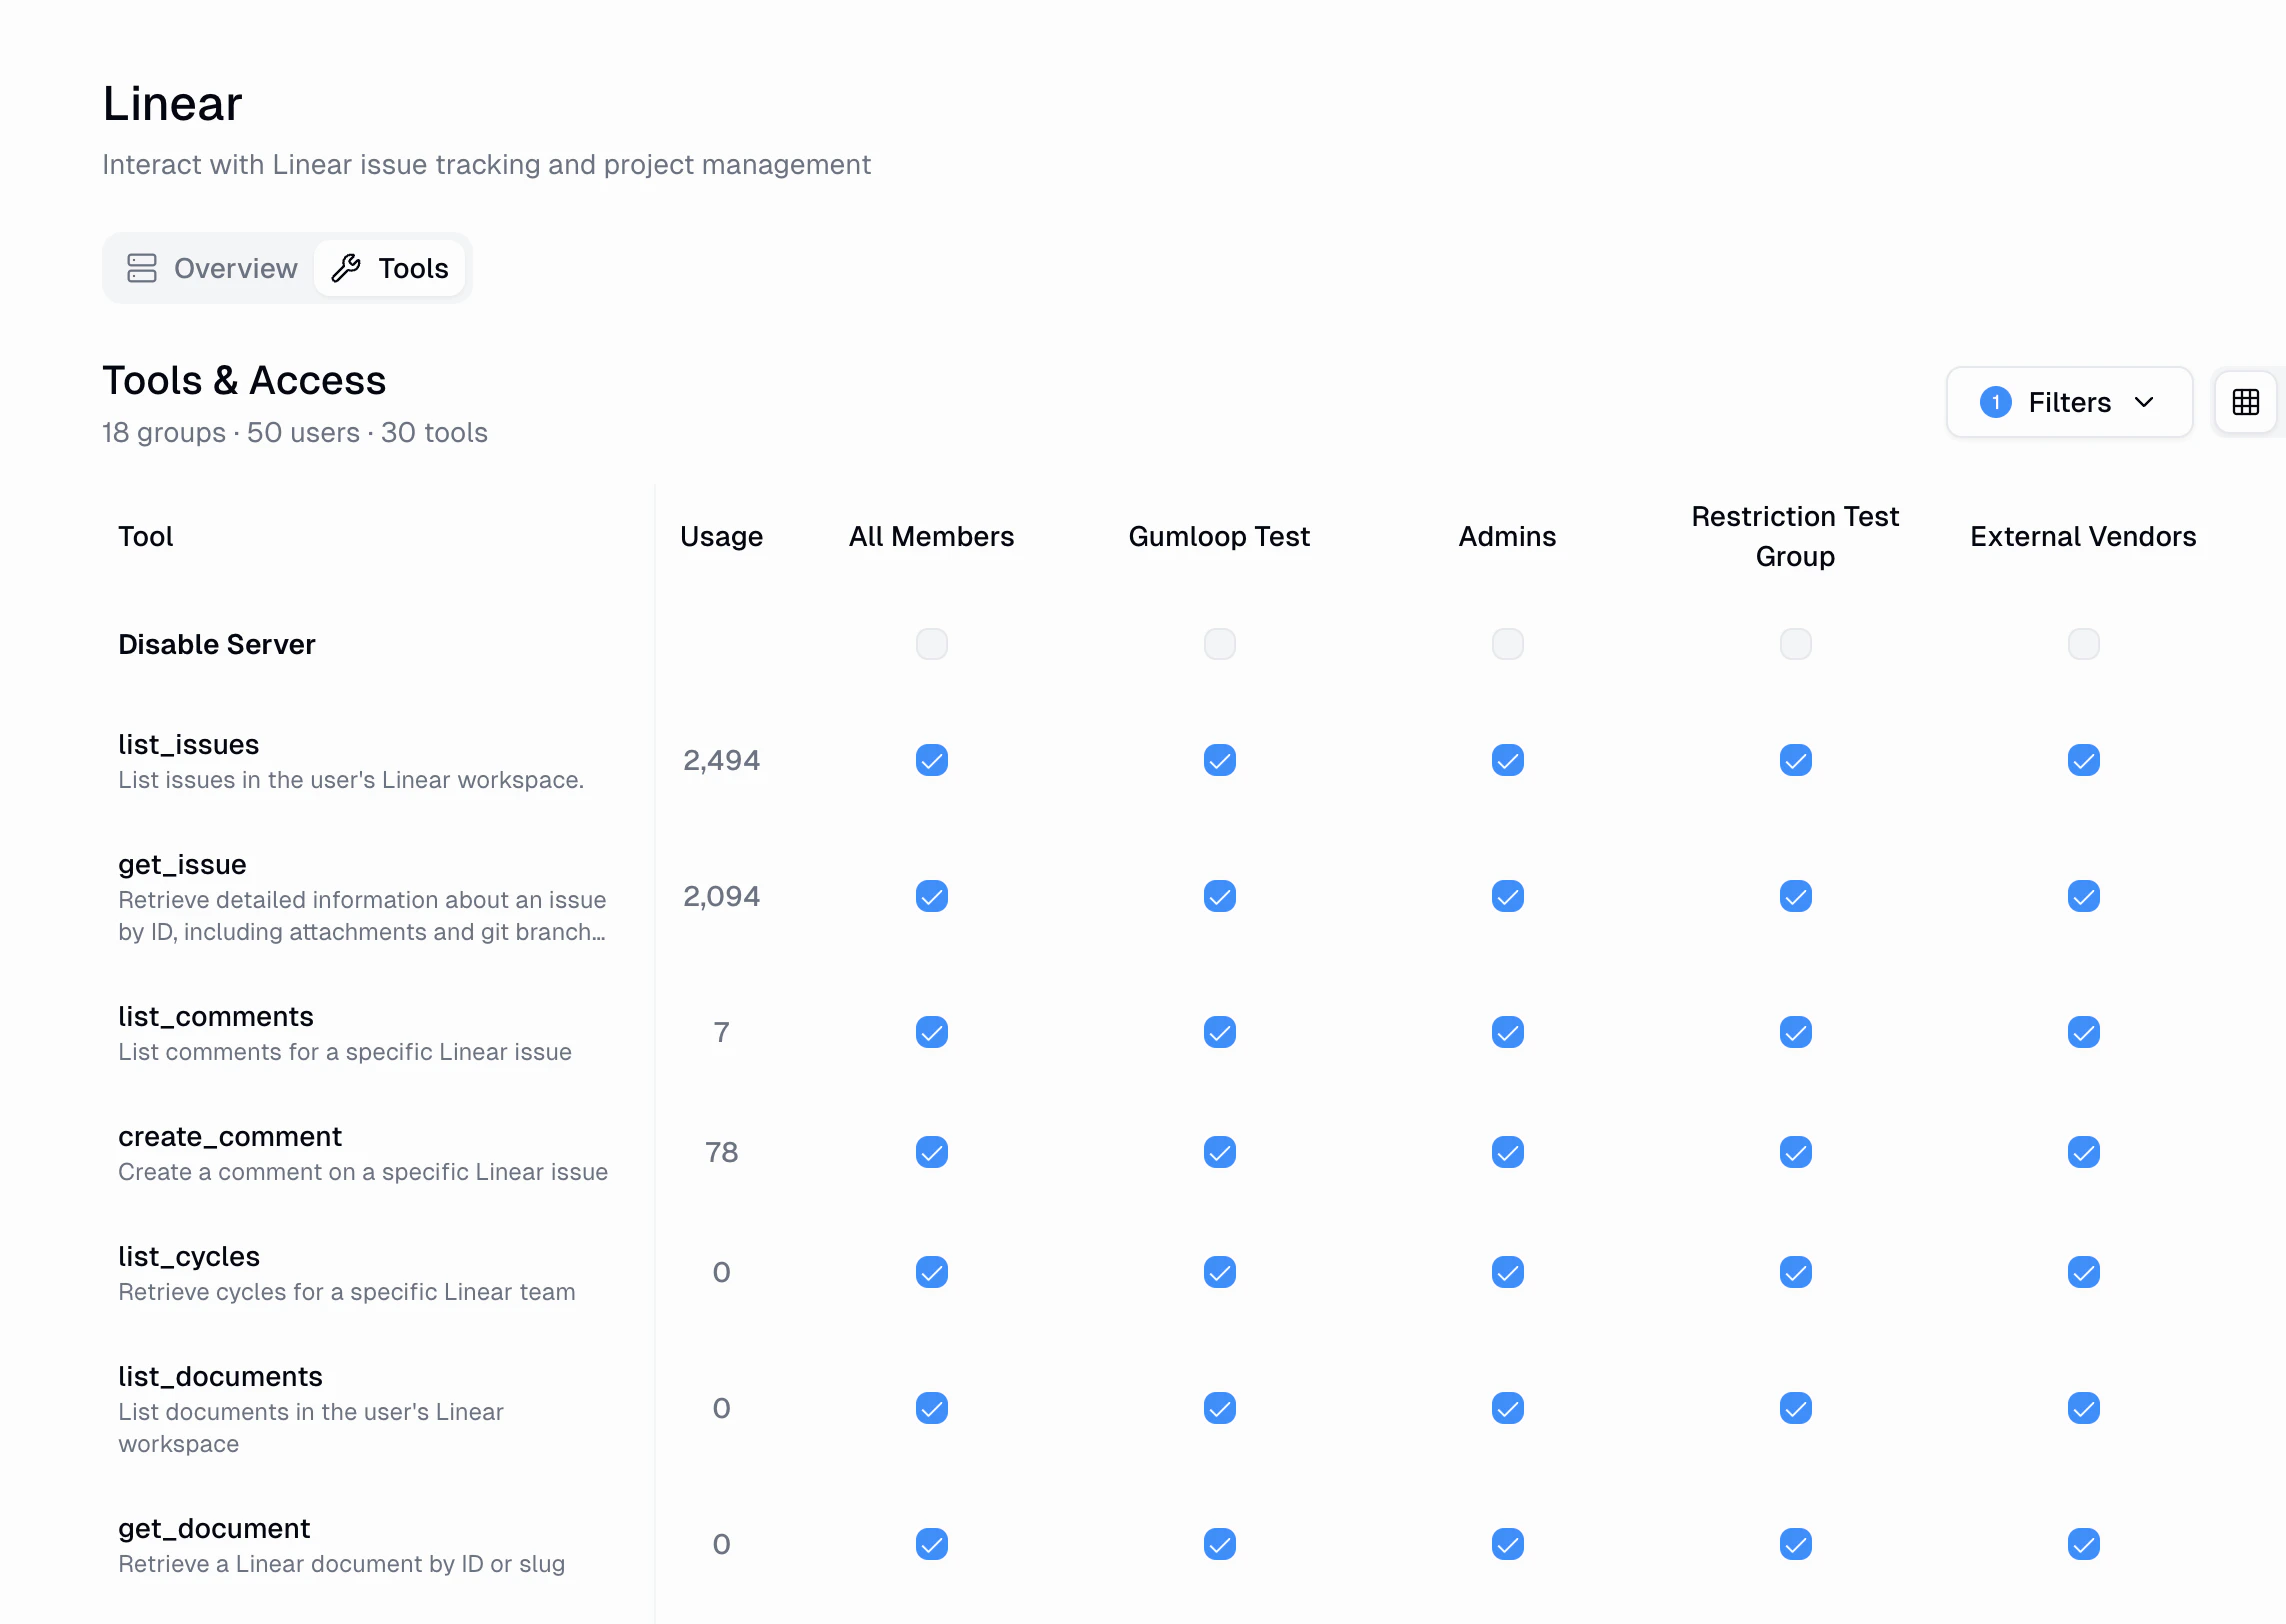 Each row shows:
* **Tool name and description**
* **Usage count**: How many times the tool has been called
* **Per-role toggles**: Enable or disable the tool for each custom role
You can also **Disable Server** entirely for a specific group using the toggle at the top of the matrix. This blocks all tools on that server for members of that group.
## Scoped Analytics
If you are not an organization admin or manager, App Activity automatically scopes the view to show **only your own activity**. This means every user has access to their personal tool call history without being able to see other users' data.
## FAQ
Activity data is available for the lifetime of your organization. Use the
**Date Range** filter to look at historical data beyond the default 24-hour
view.
Yes. Use the **Source** filter to narrow results to a specific origin, and
the **User** filter to find calls made by a particular user or agent.
A tool call with **Permission Denied** status was blocked by your
organization's [App Policies](/enterprise-features/app-policies/overview)
or tool access settings. Check the **Tools & Access** tab on the relevant
server, or review your App Rules.
[Audit Logging](/enterprise-features/audit_logging) tracks administrative
actions across the platform (sign-ins, credential changes, team management,
etc.). App Activity specifically tracks **MCP tool calls and integration
usage**, giving you deeper visibility into what your AI agents and
automations are actually doing.
Each row shows:
* **Tool name and description**
* **Usage count**: How many times the tool has been called
* **Per-role toggles**: Enable or disable the tool for each custom role
You can also **Disable Server** entirely for a specific group using the toggle at the top of the matrix. This blocks all tools on that server for members of that group.
## Scoped Analytics
If you are not an organization admin or manager, App Activity automatically scopes the view to show **only your own activity**. This means every user has access to their personal tool call history without being able to see other users' data.
## FAQ
Activity data is available for the lifetime of your organization. Use the
**Date Range** filter to look at historical data beyond the default 24-hour
view.
Yes. Use the **Source** filter to narrow results to a specific origin, and
the **User** filter to find calls made by a particular user or agent.
A tool call with **Permission Denied** status was blocked by your
organization's [App Policies](/enterprise-features/app-policies/overview)
or tool access settings. Check the **Tools & Access** tab on the relevant
server, or review your App Rules.
[Audit Logging](/enterprise-features/audit_logging) tracks administrative
actions across the platform (sign-ins, credential changes, team management,
etc.). App Activity specifically tracks **MCP tool calls and integration
usage**, giving you deeper visibility into what your AI agents and
automations are actually doing.