> ## Documentation Index
> Fetch the complete documentation index at: https://docs.gumloop.com/llms.txt
> Use this file to discover all available pages before exploring further.
# Agent Performance
> Insights, Evaluations, and Tasks for a single agent
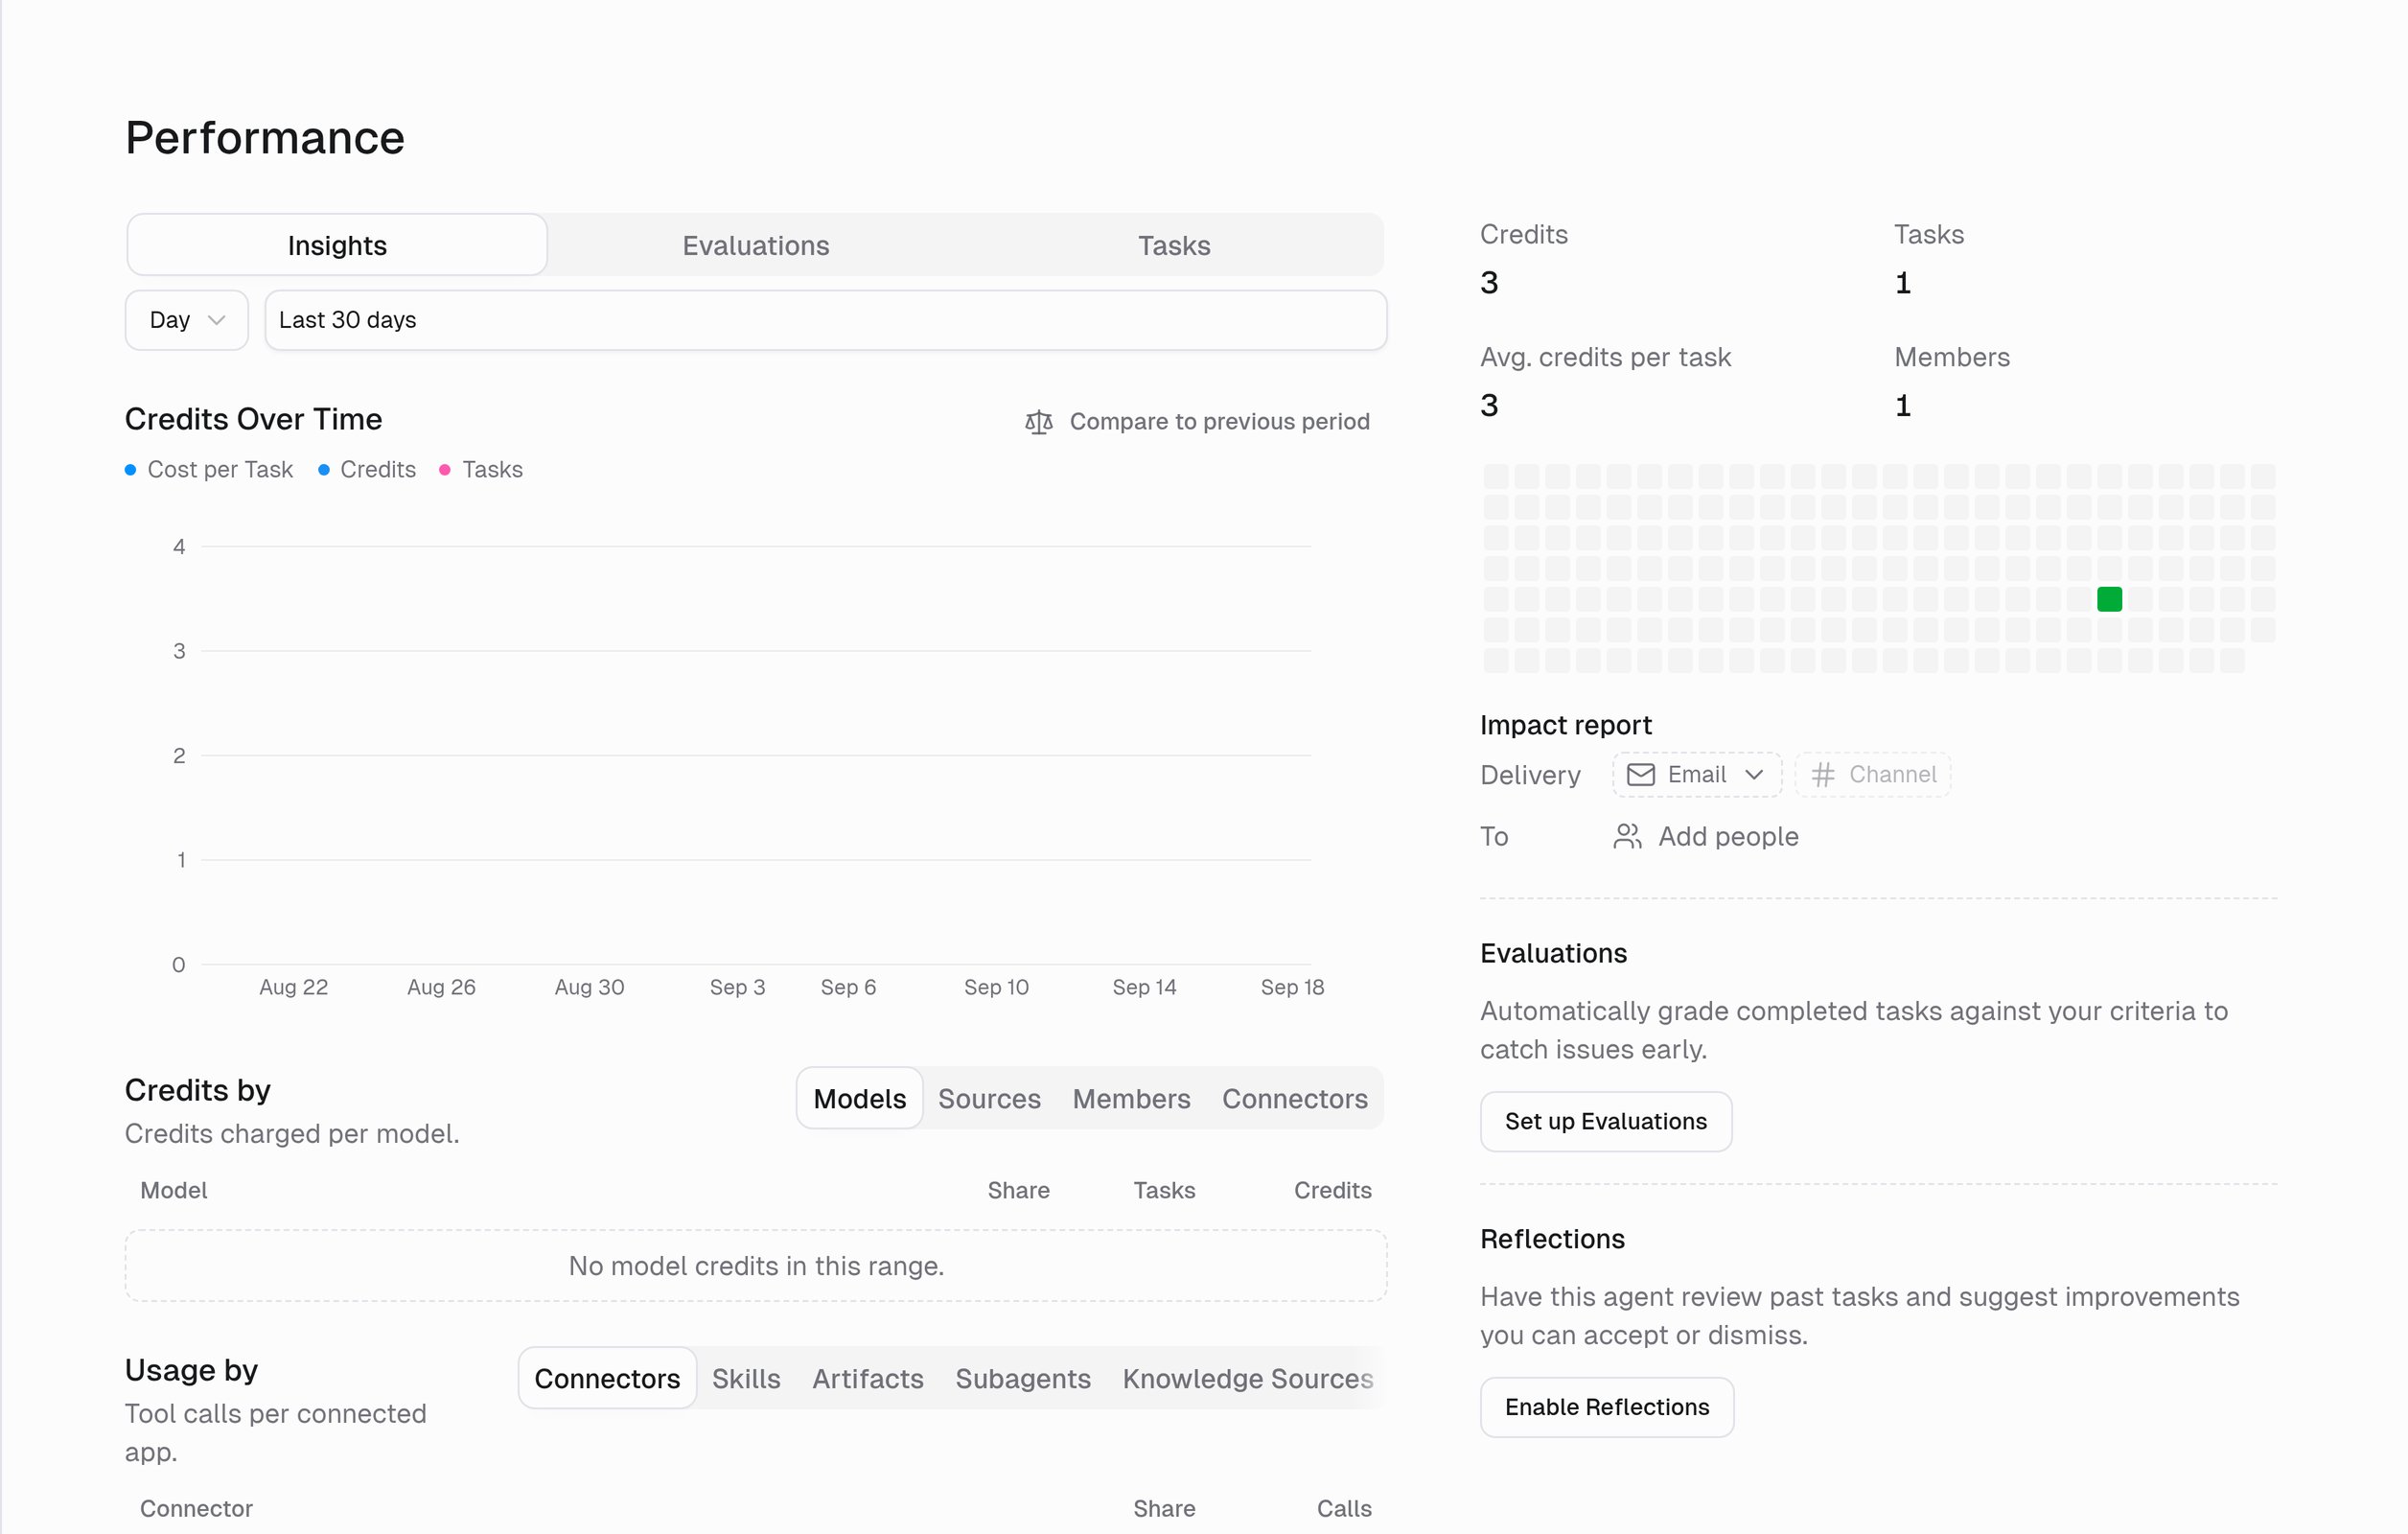
**Performance** in the agent sidebar answers three questions about one agent: what is it costing, is it doing good work, and what has it actually been doing. Those are the three tabs.
This page is the map of that screen. Two of the things you switch on from it — **Evaluations** and **Reflections** — have their own guides, linked below.
 Performance covers the tasks you are allowed to see. Owners see everything on the agent; a User's numbers follow the agent's [Task Visibility](/core-concepts/agent_access#task-visibility). For organization-wide reporting, see [Insights](/enterprise-features/organization_insights).
## Insights
Pick a date range and an interval (**Day**, **Week**, or **Month**), and optionally **Compare to previous period** to see the change.
**Credits Over Time** charts three series together — credits, tasks, and cost per task — so you can tell a spike in spend apart from a spike in usage.
The overview on the right gives you the headline numbers for the range:
| Metric | What it counts |
| ------------------------- | ---------------------------------------------------------------- |
| **Credits** | Credits the agent consumed. |
| **Tasks** | Tasks started with the agent. |
| **Avg. credits per task** | Credits divided by tasks — the number to watch when tuning cost. |
| **Members** | Distinct people who used it. |
Under the chart, two breakdown tables:
* **Credits by** — **Models**, **Sources** (where tasks came from, such as a trigger, Slack, or the app), **Members**, and **Connectors**.
* **Usage by** — tool calls and reads per **Connector**, **Skill**, **Artifact**, **Subagent**, and **Knowledge Source**.
**Reading it.** High credits with few tasks usually means long tasks on an expensive model: check *Credits by Models* and consider a cheaper model or a lower [summarization trigger](/core-concepts/agents#ai-advanced-settings). Lots of tasks with almost no connector usage often means people are asking the agent things it has no tools for.
### Impact report
Have Gumloop send this summary out on a schedule, by **Email** or to a **Channel**, to the people you add under **To**. Useful for keeping a team lead in the loop without giving them the builder.
### Evaluations and Reflections
Both features live in the summary panel on the right of this page, and both are switched on from here:
| Feature | What it does | Turn it on | Full guide |
| --------------- | --------------------------------------------------------------------------------------------------------------------- | ---------------------- | ----------------------------------------- |
| **Evaluations** | Grades completed tasks against criteria you write, so a regression shows up as a failed check instead of a complaint. | **Set up Evaluations** | [Evaluations](/core-concepts/evaluations) |
| **Reflections** | Has the agent review its own past tasks and suggest instruction changes you accept or dismiss. | **Enable Reflections** | [Reflections](/core-concepts/reflections) |
Everything else about them — criteria, tags, data points, schedules, reports, and the API — is in those two guides.
## Evaluations tab
Once evaluations are on, this tab shows the grades: how completed tasks scored against your criteria, which ones failed, and the trend over time. That is where you catch a regression after changing the instructions or the model.
## Tasks tab
The full task history for the agent, filterable, with who started each one, where it came from, and what it cost. Open a task to read the whole thing. This is the fastest way to answer "what did it actually do yesterday?" and to spot the pattern behind a bad evaluation score.
## Related
Define criteria and grade the agent's answers.
Let the agent propose its own improvements.
What the agent is charged for.
The same picture across every agent and team.
Performance covers the tasks you are allowed to see. Owners see everything on the agent; a User's numbers follow the agent's [Task Visibility](/core-concepts/agent_access#task-visibility). For organization-wide reporting, see [Insights](/enterprise-features/organization_insights).
## Insights
Pick a date range and an interval (**Day**, **Week**, or **Month**), and optionally **Compare to previous period** to see the change.
**Credits Over Time** charts three series together — credits, tasks, and cost per task — so you can tell a spike in spend apart from a spike in usage.
The overview on the right gives you the headline numbers for the range:
| Metric | What it counts |
| ------------------------- | ---------------------------------------------------------------- |
| **Credits** | Credits the agent consumed. |
| **Tasks** | Tasks started with the agent. |
| **Avg. credits per task** | Credits divided by tasks — the number to watch when tuning cost. |
| **Members** | Distinct people who used it. |
Under the chart, two breakdown tables:
* **Credits by** — **Models**, **Sources** (where tasks came from, such as a trigger, Slack, or the app), **Members**, and **Connectors**.
* **Usage by** — tool calls and reads per **Connector**, **Skill**, **Artifact**, **Subagent**, and **Knowledge Source**.
**Reading it.** High credits with few tasks usually means long tasks on an expensive model: check *Credits by Models* and consider a cheaper model or a lower [summarization trigger](/core-concepts/agents#ai-advanced-settings). Lots of tasks with almost no connector usage often means people are asking the agent things it has no tools for.
### Impact report
Have Gumloop send this summary out on a schedule, by **Email** or to a **Channel**, to the people you add under **To**. Useful for keeping a team lead in the loop without giving them the builder.
### Evaluations and Reflections
Both features live in the summary panel on the right of this page, and both are switched on from here:
| Feature | What it does | Turn it on | Full guide |
| --------------- | --------------------------------------------------------------------------------------------------------------------- | ---------------------- | ----------------------------------------- |
| **Evaluations** | Grades completed tasks against criteria you write, so a regression shows up as a failed check instead of a complaint. | **Set up Evaluations** | [Evaluations](/core-concepts/evaluations) |
| **Reflections** | Has the agent review its own past tasks and suggest instruction changes you accept or dismiss. | **Enable Reflections** | [Reflections](/core-concepts/reflections) |
Everything else about them — criteria, tags, data points, schedules, reports, and the API — is in those two guides.
## Evaluations tab
Once evaluations are on, this tab shows the grades: how completed tasks scored against your criteria, which ones failed, and the trend over time. That is where you catch a regression after changing the instructions or the model.
## Tasks tab
The full task history for the agent, filterable, with who started each one, where it came from, and what it cost. Open a task to read the whole thing. This is the fastest way to answer "what did it actually do yesterday?" and to spot the pattern behind a bad evaluation score.
## Related
Define criteria and grade the agent's answers.
Let the agent propose its own improvements.
What the agent is charged for.
The same picture across every agent and team.